 我的书签
我的书签
 添加书签
添加书签 移除书签
移除书签- VChart
- 安装
- v-chart
- 属性
- 事件
- 方法
- v-line
- 属性
- v-area
- 属性
- v-bar
- 属性
- v-pie
- v-point
- v-scale
- 属性
- v-axis
- 属性
- v-guide
- 属性
- v-legend
- 属性
- v-guide
- 属性
- 重要提示及已知问题
- 贡献者
- 发布日志
VChart
VChart
Beta
demo 原始链接编辑文档组件源码

二维码
VChart 基于F2@蚂蚁金服(MIT license)封装的图表组件。
F2 是专为移动端定制的一套开箱即用的可视化解决方案,具有精简、高性能、易扩展的特性,适用于对性能、大小、扩展性要求严苛的场景。
组件部分属性可能未列出,可以直接参考 F2文档
- 介绍
- 安装
- 栗子
- 基本折线图
- 折线图:平滑曲线
- 动态数据:实时折线
- 折线图:渐变
- 折线图:对比
- API
- 重要提示及已知问题
- 贡献者
- 版本更新
Install
安装
局部注册
全局注册
import { VChart, VLine, VArea, VBar, VPie, VPoint, VScale, VAxis, VGuide, VTooltip, VLegend, VGuide } from 'vux'export default {components: {VChart,VLine,VArea,VBar,VPie,VPoint,VScale,VAxis,VGuide,VTooltip,VLegend,VGuide}}
// 在入口文件全局引入import Vue from 'vue'import { VChart, VLine, VArea, VBar, VPie, VPoint, VScale, VAxis, VGuide, VTooltip, VLegend, VGuide } from 'vux'Vue.component('v-chart', VChart)Vue.component('v-line', VLine)Vue.component('v-area', VArea)Vue.component('v-bar', VBar)Vue.component('v-pie', VPie)Vue.component('v-point', VPoint)Vue.component('v-scale', VScale)Vue.component('v-axis', VAxis)Vue.component('v-guide', VGuide)Vue.component('v-tooltip', VTooltip)Vue.component('v-legend', VLegend)Vue.component('v-guide', VGuide)
Examples基本折线图
基本折线图
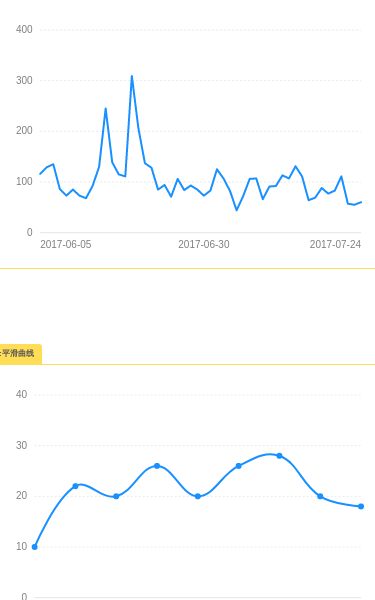
<template><div><v-chart :data="data" prevent-default><v-scale x :tick-count="3" /><v-tooltip :show-item-marker="false" show-x-value /><v-line /></v-chart></div></template><script>import { VChart, VTooltip, VLine, VScale } from 'vux'export default {components: {VChart,VTooltip,VLine,VScale},data () {return {data: [{ date: '2017-06-05', value: 116 },{ date: '2017-06-06', value: 129 },{ date: '2017-06-07', value: 135 },{ date: '2017-06-08', value: 86 },{ date: '2017-06-09', value: 73 },{ date: '2017-06-10', value: 85 },{ date: '2017-06-11', value: 73 },{ date: '2017-06-12', value: 68 },{ date: '2017-06-13', value: 92 },{ date: '2017-06-14', value: 130 },{ date: '2017-06-15', value: 245 },{ date: '2017-06-16', value: 139 },{ date: '2017-06-17', value: 115 },{ date: '2017-06-18', value: 111 },{ date: '2017-06-19', value: 309 },{ date: '2017-06-20', value: 206 },{ date: '2017-06-21', value: 137 },{ date: '2017-06-22', value: 128 },{ date: '2017-06-23', value: 85 },{ date: '2017-06-24', value: 94 },{ date: '2017-06-25', value: 71 },{ date: '2017-06-26', value: 106 },{ date: '2017-06-27', value: 84 },{ date: '2017-06-28', value: 93 },{ date: '2017-06-29', value: 85 },{ date: '2017-06-30', value: 73 },{ date: '2017-07-01', value: 83 },{ date: '2017-07-02', value: 125 },{ date: '2017-07-03', value: 107 },{ date: '2017-07-04', value: 82 },{ date: '2017-07-05', value: 44 },{ date: '2017-07-06', value: 72 },{ date: '2017-07-07', value: 106 },{ date: '2017-07-08', value: 107 },{ date: '2017-07-09', value: 66 },{ date: '2017-07-10', value: 91 },{ date: '2017-07-11', value: 92 },{ date: '2017-07-12', value: 113 },{ date: '2017-07-13', value: 107 },{ date: '2017-07-14', value: 131 },{ date: '2017-07-15', value: 111 },{ date: '2017-07-16', value: 64 },{ date: '2017-07-17', value: 69 },{ date: '2017-07-18', value: 88 },{ date: '2017-07-19', value: 77 },{ date: '2017-07-20', value: 83 },{ date: '2017-07-21', value: 111 },{ date: '2017-07-22', value: 57 },{ date: '2017-07-23', value: 55 },{ date: '2017-07-24', value: 60 }]}}}</script>
 Show code
折线图:平滑曲线
折线图:平滑曲线
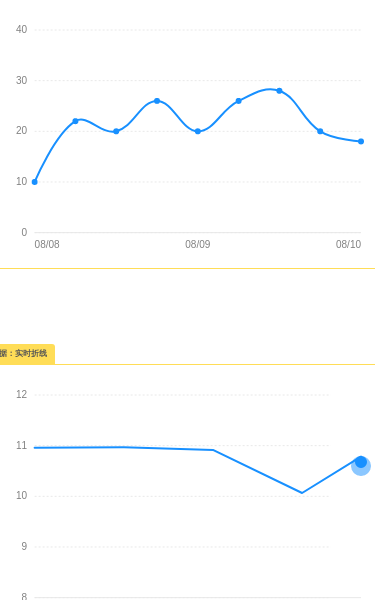
<template><div><v-chart :data="data"><v-scale x type="timeCat" mask="MM/DD" :tick-count="3" /><v-scale y :min="0" alias="日均温度" :tick-count="5" /><v-point:style="{stroke: '#fff',lineWidth: 1}"shape="smooth" /><v-line shape="smooth" /></v-chart></div></template><script>import { VChart, VLine, VPoint, VScale, VTooltip } from 'vux'export default {components: {VChart,VPoint,VLine,VScale,VTooltip},data () {return {data: [{ time: '2016-08-08 00:00:00', tem: 10 },{ time: '2016-08-08 00:10:00', tem: 22 },{ time: '2016-08-08 00:30:00', tem: 20 },{ time: '2016-08-09 00:35:00', tem: 26 },{ time: '2016-08-09 01:00:00', tem: 20 },{ time: '2016-08-09 01:20:00', tem: 26 },{ time: '2016-08-10 01:40:00', tem: 28 },{ time: '2016-08-10 02:00:00', tem: 20 },{ time: '2016-08-10 02:20:00', tem: 18 }]}}}</script><style lang='css'></style>
 Show code
动态数据:实时折线
动态数据:实时折线
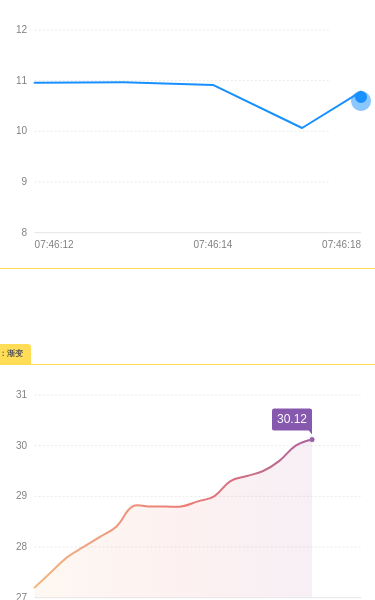
<template><div><v-chart :data="data" ref="demo"><v-scale x type="timeCat" :tick-count="3" mask="hh:mm:ss" /><v-scale y :min="8" :tick-count="5" /><v-tooltip :show-item-marker="false" show-x-value /><v-guide type="html" :options="guide1" /><v-guide type="html" :options="guide2" /><v-line /></v-chart></div></template><script>import { VChart, VTooltip, VLine, VScale, VGuide } from 'vux'const data = []// 添加数据,模拟数据,可以指定当前时间的偏移的秒function getRecord (offset) {offset = offset || 0return {time: new Date().getTime() + offset * 1000,value: Math.random() + 10}}data.push(getRecord(-2))data.push(getRecord(-1))data.push(getRecord())export default {components: {VChart,VTooltip,VLine,VScale,VGuide},mounted () {this.timer = setInterval(() => {data.push(getRecord())}, 2000)},beforeDestroy () {clearInterval(this.timer)},data () {return {guide1: {position (xScale, yScales) {const xValues = xScale.valuesconst yValues = yScales[0].valuesconst xMax = xValues[xValues.length - 1]const yMax = yValues[yValues.length - 1]return [ xMax, yMax ]},html: '<div style="border-radius: 100%;border: none;width: 12px;height: 12px;background-color: rgb(24, 144, 255);transition: top 0.35s cubic-bezier(0.23, 1, 0.32, 1);"></div>'},guide2: {position (xScale, yScales) {const xValues = xScale.valuesconst yValues = yScales[0].valuesconst xMax = xValues[xValues.length - 1]const yMax = yValues[yValues.length - 1]return [ xMax, yMax ]},html: '<div style="border-radius: 100%;border: none;width: 20px;height: 20px;background-color: rgba(24, 144, 255, 0.5);transition: top 0.35s cubic-bezier(0.23, 1, 0.32, 1);"></div>'},data}}}</script>
 Show code
折线图:渐变
折线图:渐变
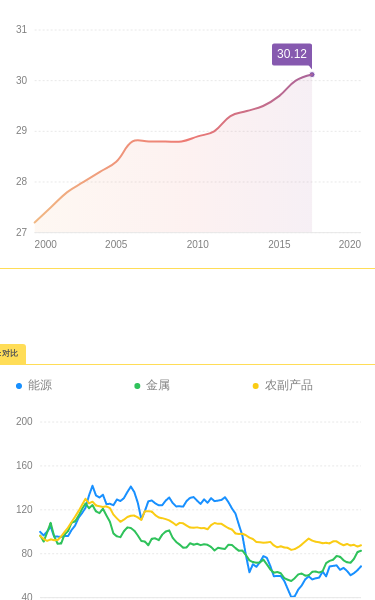
<template><div><v-chart :data="data"><v-scale x :tick-count="5" :max="2020" /><v-line shape="smooth" :colors="gradient"/><v-guide type="tag" :options="tag" /><v-area shape="smooth" :colors="gradient"/></v-chart></div></template><script>import { VChart, VGuide, VLine, VArea, VScale } from 'vux'export default {components: {VChart,VGuide,VArea,VLine,VScale},data () {return {gradient: [[0, '#F2C587'],[0.5, '#ED7973'],[1, '#8659AF']],tag: {position: [ 2017, 30.12 ],content: '30.12',direct: 'tl',offsetY: -5,background: {fill: '#8659AF'},pointStyle: {fill: '#8659AF'}},data: [{ year: 2000, age: 27.2 },{ year: 2001, age: 27.5 },{ year: 2002, age: 27.8 },{ year: 2003, age: 28 },{ year: 2004, age: 28.2 },{ year: 2005, age: 28.4 },{ year: 2006, age: 28.8 },{ year: 2007, age: 28.8 },{ year: 2008, age: 28.8 },{ year: 2009, age: 28.8 },{ year: 2010, age: 28.9 },{ year: 2011, age: 29 },{ year: 2012, age: 29.3 },{ year: 2013, age: 29.4 },{ year: 2014, age: 29.5 },{ year: 2015, age: 29.7 },{ year: 2016, age: 30 },{ year: 2017, age: 30.12 }]}}}</script>
 Show code
折线图:对比
折线图:对比
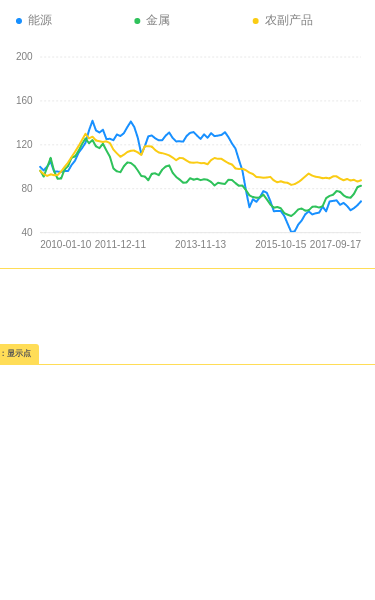
<template><div><v-chart :data="data"><v-line series-field="type" /></v-chart></div></template><script>import { VChart, VLine, VAxis, VTooltip } from 'vux'/** [* {"date":"2010-01-10","type":"能源","value":99.9},* {"date":"2010-01-10","type":"金属","value":96.6}* ]*/import data from './line_color.json'export default {components: {VChart,VLine,VAxis,VTooltip},data () {return {data}}}</script>
 Show code
折线图:显示点
折线图:显示点
<template><div><v-chart :data="data"><v-scale y :min="0" /> <!-- 默认 y 轴数值从数据的最小值到最大值,此处重置为从 0 开始 --><v-point :styles="{stroke: '#fff',lineWidth: 1}"/><v-tooltip :show-item-marker="false" :on-show="onShow" /> <!-- onShow 为 F2 属性而非事件--><v-line /></v-chart></div></template><script>import { VChart, VPoint, VTooltip, VLine, VScale } from 'vux'export default {components: {VChart,VPoint,VTooltip,VLine,VScale},data () {return {onShow (ev) {const { items } = evitems[0].name = nullitems[0].value = '$ ' + items[0].value},data: [{ day: '周一', value: 300 },{ day: '周二', value: 400 },{ day: '周三', value: 350 },{ day: '周四', value: 500 },{ day: '周五', value: 490 },{ day: '周六', value: 600 },{ day: '周日', value: 900 }]}}}</script><style lang='css'></style>
 Show code
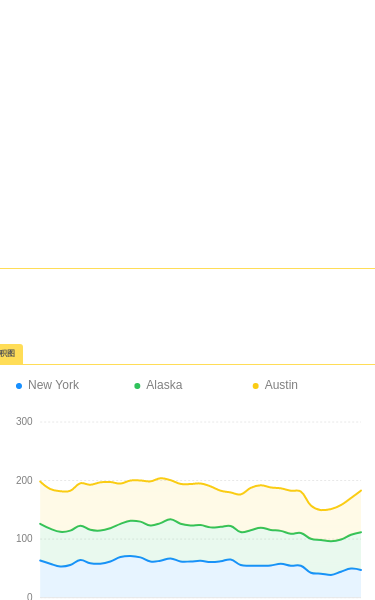
层叠面积图
层叠面积图
<template><div><v-chart :data="data"><v-scale x field="date" type="timeCat" mask="MM-DD" /><v-scale y field="value" :tick-count="4" :max="300" /><v-tooltip show-crosshairs show-value-in-legend /><v-area series-field="city" shape="smooth" adjust="stack" /><v-line series-field="city" shape="smooth" adjust="stack" /></v-chart></div></template><script>import { VChart, VLine, VArea, VTooltip, VLegend, VScale } from 'vux'export default {components: {VChart,VLine,VArea,VTooltip,VLegend,VScale},data () {return {data: [{ value: 63.4, city: 'New York', date: '2011-10-01' },{ value: 62.7, city: 'Alaska', date: '2011-10-01' },{ value: 72.2, city: 'Austin', date: '2011-10-01' },{ value: 58, city: 'New York', date: '2011-10-02' },{ value: 59.9, city: 'Alaska', date: '2011-10-02' },{ value: 67.7, city: 'Austin', date: '2011-10-02' },{ value: 53.3, city: 'New York', date: '2011-10-03' },{ value: 59.1, city: 'Alaska', date: '2011-10-03' },{ value: 69.4, city: 'Austin', date: '2011-10-03' },{ value: 55.7, city: 'New York', date: '2011-10-04' },{ value: 58.8, city: 'Alaska', date: '2011-10-04' },{ value: 68, city: 'Austin', date: '2011-10-04' },{ value: 64.2, city: 'New York', date: '2011-10-05' },{ value: 58.7, city: 'Alaska', date: '2011-10-05' },{ value: 72.4, city: 'Austin', date: '2011-10-05' },{ value: 58.8, city: 'New York', date: '2011-10-06' },{ value: 57, city: 'Alaska', date: '2011-10-06' },{ value: 77, city: 'Austin', date: '2011-10-06' },{ value: 57.9, city: 'New York', date: '2011-10-07' },{ value: 56.7, city: 'Alaska', date: '2011-10-07' },{ value: 82.3, city: 'Austin', date: '2011-10-07' },{ value: 61.8, city: 'New York', date: '2011-10-08' },{ value: 56.8, city: 'Alaska', date: '2011-10-08' },{ value: 78.9, city: 'Austin', date: '2011-10-08' },{ value: 69.3, city: 'New York', date: '2011-10-09' },{ value: 56.7, city: 'Alaska', date: '2011-10-09' },{ value: 68.8, city: 'Austin', date: '2011-10-09' },{ value: 71.2, city: 'New York', date: '2011-10-10' },{ value: 60.1, city: 'Alaska', date: '2011-10-10' },{ value: 68.7, city: 'Austin', date: '2011-10-10' },{ value: 68.7, city: 'New York', date: '2011-10-11' },{ value: 61.1, city: 'Alaska', date: '2011-10-11' },{ value: 70.3, city: 'Austin', date: '2011-10-11' },{ value: 61.8, city: 'New York', date: '2011-10-12' },{ value: 61.5, city: 'Alaska', date: '2011-10-12' },{ value: 75.3, city: 'Austin', date: '2011-10-12' },{ value: 63, city: 'New York', date: '2011-10-13' },{ value: 64.3, city: 'Alaska', date: '2011-10-13' },{ value: 76.6, city: 'Austin', date: '2011-10-13' },{ value: 66.9, city: 'New York', date: '2011-10-14' },{ value: 67.1, city: 'Alaska', date: '2011-10-14' },{ value: 66.6, city: 'Austin', date: '2011-10-14' },{ value: 61.7, city: 'New York', date: '2011-10-15' },{ value: 64.6, city: 'Alaska', date: '2011-10-15' },{ value: 68, city: 'Austin', date: '2011-10-15' },{ value: 61.8, city: 'New York', date: '2011-10-16' },{ value: 61.6, city: 'Alaska', date: '2011-10-16' },{ value: 70.6, city: 'Austin', date: '2011-10-16' },{ value: 62.8, city: 'New York', date: '2011-10-17' },{ value: 61.1, city: 'Alaska', date: '2011-10-17' },{ value: 71.1, city: 'Austin', date: '2011-10-17' },{ value: 60.8, city: 'New York', date: '2011-10-18' },{ value: 59.2, city: 'Alaska', date: '2011-10-18' },{ value: 70, city: 'Austin', date: '2011-10-18' },{ value: 62.1, city: 'New York', date: '2011-10-19' },{ value: 58.9, city: 'Alaska', date: '2011-10-19' },{ value: 61.6, city: 'Austin', date: '2011-10-19' },{ value: 65.1, city: 'New York', date: '2011-10-20' },{ value: 57.2, city: 'Alaska', date: '2011-10-20' },{ value: 57.4, city: 'Austin', date: '2011-10-20' },{ value: 55.6, city: 'New York', date: '2011-10-21' },{ value: 56.4, city: 'Alaska', date: '2011-10-21' },{ value: 64.3, city: 'Austin', date: '2011-10-21' },{ value: 54.4, city: 'New York', date: '2011-10-22' },{ value: 60.7, city: 'Alaska', date: '2011-10-22' },{ value: 72.4, city: 'Austin', date: '2011-10-22' },{ value: 54.4, city: 'New York', date: '2011-10-23' },{ value: 65.1, city: 'Alaska', date: '2011-10-23' },{ value: 72.4, city: 'Austin', date: '2011-10-23' },{ value: 54.8, city: 'New York', date: '2011-10-24' },{ value: 60.9, city: 'Alaska', date: '2011-10-24' },{ value: 72.5, city: 'Austin', date: '2011-10-24' },{ value: 57.9, city: 'New York', date: '2011-10-25' },{ value: 56.1, city: 'Alaska', date: '2011-10-25' },{ value: 72.7, city: 'Austin', date: '2011-10-25' },{ value: 54.6, city: 'New York', date: '2011-10-26' },{ value: 54.6, city: 'Alaska', date: '2011-10-26' },{ value: 73.4, city: 'Austin', date: '2011-10-26' },{ value: 54.4, city: 'New York', date: '2011-10-27' },{ value: 56.1, city: 'Alaska', date: '2011-10-27' },{ value: 70.7, city: 'Austin', date: '2011-10-27' },{ value: 42.5, city: 'New York', date: '2011-10-28' },{ value: 58.1, city: 'Alaska', date: '2011-10-28' },{ value: 56.8, city: 'Austin', date: '2011-10-28' },{ value: 40.9, city: 'New York', date: '2011-10-29' },{ value: 57.5, city: 'Alaska', date: '2011-10-29' },{ value: 51, city: 'Austin', date: '2011-10-29' },{ value: 38.6, city: 'New York', date: '2011-10-30' },{ value: 57.7, city: 'Alaska', date: '2011-10-30' },{ value: 54.9, city: 'Austin', date: '2011-10-30' },{ value: 44.2, city: 'New York', date: '2011-10-31' },{ value: 55.1, city: 'Alaska', date: '2011-10-31' },{ value: 58.8, city: 'Austin', date: '2011-10-31' },{ value: 49.6, city: 'New York', date: '2011-11-01' },{ value: 57.9, city: 'Alaska', date: '2011-11-01' },{ value: 62.6, city: 'Austin', date: '2011-11-01' },{ value: 47.2, city: 'New York', date: '2011-11-02' },{ value: 64.6, city: 'Alaska', date: '2011-11-02' },{ value: 71, city: 'Austin', date: '2011-11-02' }]}}}</script>
 Show code
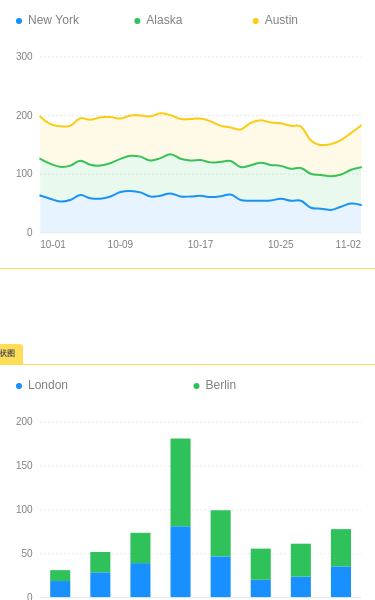
层叠柱状图
层叠柱状图
<template><div><v-chart ref="demo" :data="data"><v-scale x field="月份" /><v-scale y field="月均降雨量" /><v-bar series-field="name" adjust="stack" /><v-tooltip show-value-in-legend /></v-chart><x-button type="primary" plain @click.native="$refs.demo.rerender()">rerender</x-button></div></template><script>import { VChart, VLine, VArea, VTooltip, VLegend, VBar, XButton, VScale } from 'vux'export default {components: {VChart,VLine,VArea,VTooltip,VLegend,VBar,XButton,VScale},data () {return {data: [{ name: 'London', 月份: 'Jan.', 月均降雨量: 18.9 },{ name: 'London', 月份: 'Feb.', 月均降雨量: 28.8 },{ name: 'London', 月份: 'Mar.', 月均降雨量: 39.3 },{ name: 'London', 月份: 'Apr.', 月均降雨量: 81.4 },{ name: 'London', 月份: 'May.', 月均降雨量: 47 },{ name: 'London', 月份: 'Jun.', 月均降雨量: 20.3 },{ name: 'London', 月份: 'Jul.', 月均降雨量: 24 },{ name: 'London', 月份: 'Aug.', 月均降雨量: 35.6 },{ name: 'Berlin', 月份: 'Jan.', 月均降雨量: 12.4 },{ name: 'Berlin', 月份: 'Feb.', 月均降雨量: 23.2 },{ name: 'Berlin', 月份: 'Mar.', 月均降雨量: 34.5 },{ name: 'Berlin', 月份: 'Apr.', 月均降雨量: 99.7 },{ name: 'Berlin', 月份: 'May.', 月均降雨量: 52.6 },{ name: 'Berlin', 月份: 'Jun.', 月均降雨量: 35.5 },{ name: 'Berlin', 月份: 'Jul.', 月均降雨量: 37.4 },{ name: 'Berlin', 月份: 'Aug.', 月均降雨量: 42.4 }]}}}</script>
 Show code
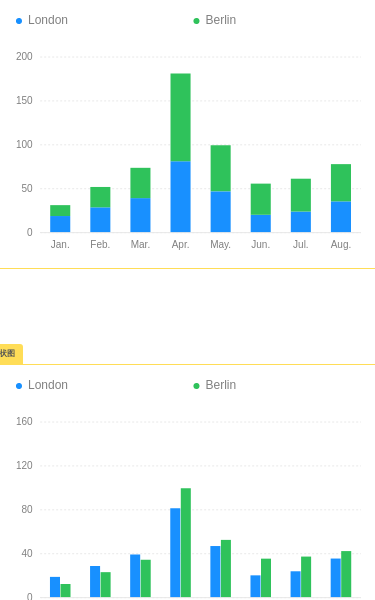
分组柱状图
分组柱状图
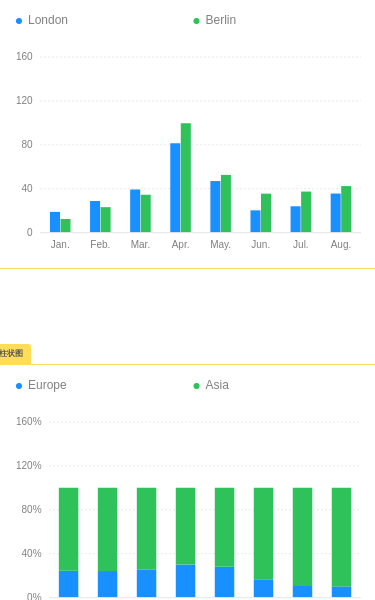
<template><div><v-chartref="demo":data="data"><v-scale x field="月份" /><v-scale y field="月均降雨量" /><v-bar series-field="name" :adjust="{type: 'dodge',marginRatio: 0.05 // 设置分组间柱子的间距}" /><v-tooltip show-value-in-legend /></v-chart><x-button type="primary" plain @click.native="$refs.demo.rerender()">rerender</x-button></div></template><script>import { VChart, VLine, VArea, VTooltip, VLegend, VBar, XButton, VScale } from 'vux'export default {components: {VChart,VLine,VArea,VTooltip,VLegend,VBar,XButton,VScale},data () {return {data: [{ name: 'London', 月份: 'Jan.', 月均降雨量: 18.9 },{ name: 'London', 月份: 'Feb.', 月均降雨量: 28.8 },{ name: 'London', 月份: 'Mar.', 月均降雨量: 39.3 },{ name: 'London', 月份: 'Apr.', 月均降雨量: 81.4 },{ name: 'London', 月份: 'May.', 月均降雨量: 47 },{ name: 'London', 月份: 'Jun.', 月均降雨量: 20.3 },{ name: 'London', 月份: 'Jul.', 月均降雨量: 24 },{ name: 'London', 月份: 'Aug.', 月均降雨量: 35.6 },{ name: 'Berlin', 月份: 'Jan.', 月均降雨量: 12.4 },{ name: 'Berlin', 月份: 'Feb.', 月均降雨量: 23.2 },{ name: 'Berlin', 月份: 'Mar.', 月均降雨量: 34.5 },{ name: 'Berlin', 月份: 'Apr.', 月均降雨量: 99.7 },{ name: 'Berlin', 月份: 'May.', 月均降雨量: 52.6 },{ name: 'Berlin', 月份: 'Jun.', 月均降雨量: 35.5 },{ name: 'Berlin', 月份: 'Jul.', 月均降雨量: 37.4 },{ name: 'Berlin', 月份: 'Aug.', 月均降雨量: 42.4 }]}}}</script>
 Show code
百分比柱状图
百分比柱状图
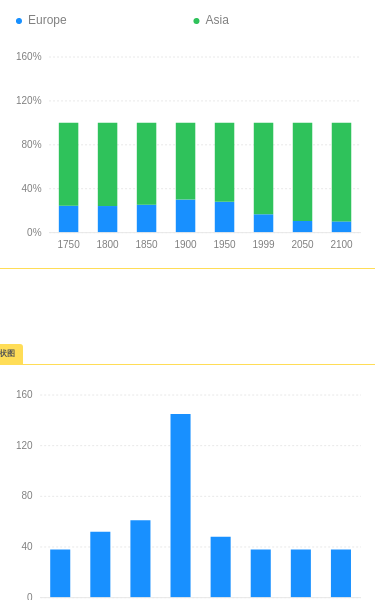
<template><div><v-chart ref="demo" :data="data"><v-scale x field="year" /><v-scale y field="percent" :min="0" :max="0.5" :formatter="formatter" /><v-bar series-field="country" adjust="stack" /><v-tooltip show-value-in-legend /></v-chart><x-button type="primary" plain @click.native="$refs.demo.rerender()">rerender</x-button></div></template><script>import { VChart, VLine, VArea, VTooltip, VLegend, VBar, XButton, VScale } from 'vux'export default {components: {VChart,VLine,VArea,VTooltip,VLegend,VBar,XButton,VScale},data () {return {formatter: function (val) {return (val * 100).toFixed(0) + '%'},data: [{ country: 'Europe', year: '1750', value: 163, percent: 0.24511278195488723 },{ country: 'Asia', year: '1750', value: 502, percent: 0.7548872180451128 },{ country: 'Europe', year: '1800', value: 203, percent: 0.24224343675417662 },{ country: 'Asia', year: '1800', value: 635, percent: 0.7577565632458234 },{ country: 'Europe', year: '1850', value: 276, percent: 0.2543778801843318 },{ country: 'Asia', year: '1850', value: 809, percent: 0.7456221198156682 },{ country: 'Europe', year: '1900', value: 408, percent: 0.3011070110701107 },{ country: 'Asia', year: '1900', value: 947, percent: 0.6988929889298893 },{ country: 'Europe', year: '1950', value: 547, percent: 0.2806567470497691 },{ country: 'Asia', year: '1950', value: 1402, percent: 0.7193432529502309 },{ country: 'Europe', year: '1999', value: 729, percent: 0.16708686683474674 },{ country: 'Asia', year: '1999', value: 3634, percent: 0.8329131331652533 },{ country: 'Europe', year: '2050', value: 628, percent: 0.10651289009497965 },{ country: 'Asia', year: '2050', value: 5268, percent: 0.8934871099050203 },{ country: 'Europe', year: '2100', value: 828, percent: 0.10227272727272728 },{ country: 'Asia', year: '2100', value: 7268, percent: 0.8977272727272727 }]}}}</script>
 Show code
基础柱状图
基础柱状图
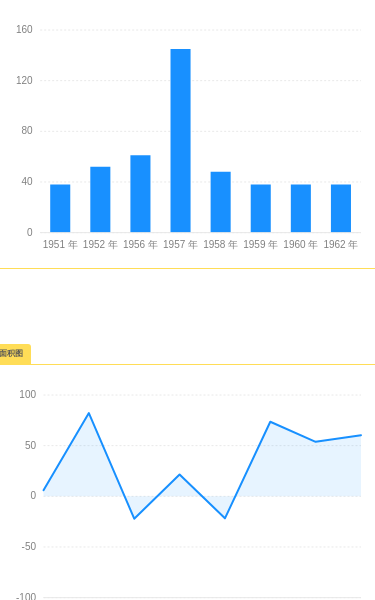
<template><div><v-chartref="demo":data="data"><v-bar /><v-tooltip :show-item-marker="false" /></v-chart><x-button type="primary" plain @click.native="$refs.demo.rerender()">rerender</x-button></div></template><script>import { VChart, VLine, VArea, VTooltip, VLegend, VBar, XButton } from 'vux'export default {components: {VChart,VLine,VArea,VTooltip,VLegend,VBar,XButton},data () {return {data: [{ year: '1951 年', sales: 38 },{ year: '1952 年', sales: 52 },{ year: '1956 年', sales: 61 },{ year: '1957 年', sales: 145 },{ year: '1958 年', sales: 48 },{ year: '1959 年', sales: 38 },{ year: '1960 年', sales: 38 },{ year: '1962 年', sales: 38 }]}}}</script>
 Show code
带负值面积图
带负值面积图
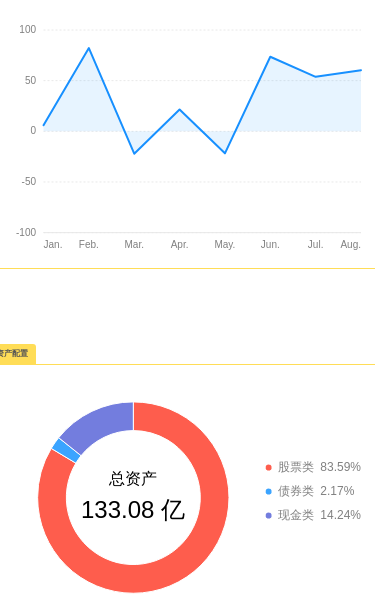
<template><div><v-chart:data="data"><v-scale x :tick-count="0" /><v-scale y :nice="false" :min="-100" :max="100" /><v-tooltip /><v-area /><v-line /></v-chart></div></template><script>import { VChart, VLine, VArea, VTooltip, VScale } from 'vux'export default {components: {VChart,VLine,VArea,VTooltip,VScale},data () {return {tooltip: {showItemMarker: false,onShow (ev) {const { items } = evitems[0].name = items[0].title}},data: [{ month: 'Jan.', value: 6.06 },{ month: 'Feb.', value: 82.2 },{ month: 'Mar.', value: -22.11 },{ month: 'Apr.', value: 21.53 },{ month: 'May.', value: -21.74 },{ month: 'Jun.', value: 73.61 },{ month: 'Jul.', value: 53.75 },{ month: 'Aug.', value: 60.32 }]}}}</script>
 Show code
环图: 资产配置
环图: 资产配置
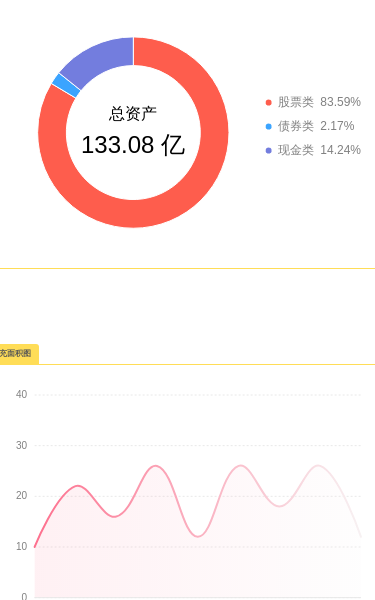
<template><div><v-chart:data="data":padding="[20, 'auto']"><v-tooltip disabled /><v-scale y :options="yOptions" /><v-pie :radius="0.85" :inner-radius="0.7" series-field="name" :colors="['#FE5D4D','#3BA4FF','#737DDE']" /><v-legend :options="legendOptions" /><v-guide type="html" :options="htmlOptions" /></v-chart></div></template><script>import { VChart, VLine, VArea, VTooltip, VLegend, VBar, VPie, VGuide, VScale } from 'vux'const data = [{ name: '股票类', percent: 83.59, a: '1' },{ name: '债券类', percent: 2.17, a: '1' },{ name: '现金类', percent: 14.24, a: '1' }]const map = {}data.map(obj => {map[obj.name] = obj.percent + '%'})export default {components: {VChart,VLine,VArea,VTooltip,VLegend,VBar,VPie,VGuide,VScale},data () {return {map,htmlOptions: {position: [ '50%', '45%' ],html: `<div style="width: 250px;height: 40px;text-align: center;"><div style="font-size: 16px">总资产</div><div style="font-size: 24px">133.08 亿</div></div>`},legendOptions: {position: 'right',itemFormatter (val) {return val + ' ' + map[val]}},yOptions: {formatter (val) {return val * 100 + '%'}},data}}}</script>
 Show code
渐变填充面积图
渐变填充面积图
<template><div><v-chart:data="data"><v-scale x type="timeCat" :tick-count="3" /><v-scale y :min="0"/><v-area :colors="gradient" shape="smooth" /><v-line :colors="gradient" shape="smooth" /></v-chart></div></template><script>import { VChart, VLine, VArea, VTooltip, VScale, VAxis } from 'vux'export default {components: {VChart,VLine,VArea,VTooltip,VScale,VAxis},data () {return {gradient: [[0, '#FE6384'],[1, '#f7f7f7']],data: [{ time: '2016-08-08 00:00:00', tem: 10 },{ time: '2016-08-08 00:10:00', tem: 22 },{ time: '2016-08-08 00:30:00', tem: 16 },{ time: '2016-08-09 00:35:00', tem: 26 },{ time: '2016-08-09 01:00:00', tem: 12 },{ time: '2016-08-09 01:20:00', tem: 26 },{ time: '2016-08-10 01:40:00', tem: 18 },{ time: '2016-08-10 02:00:00', tem: 26 },{ time: '2016-08-10 02:20:00', tem: 12 }]}}}</script>
 Show code
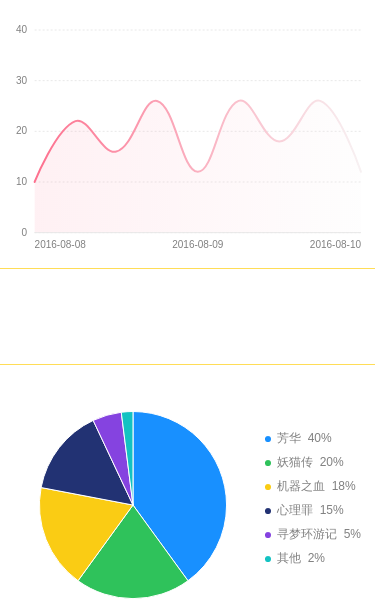
饼图
饼图
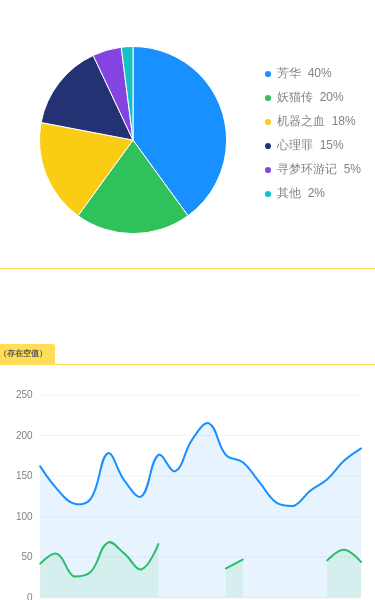
<template><div><v-chart :data="data"><v-scale y :options="yOptions" /><v-tooltip disabled /><v-pie :radius="0.85" series-field="name" /><v-legend :options="legendOptions" /></v-chart></div></template><script>import { VChart, VLine, VArea, VTooltip, VLegend, VBar, VPie, VScale } from 'vux'const map = {'芳华': '40%','妖猫传': '20%','机器之血': '18%','心理罪': '15%','寻梦环游记': '5%','其他': '2%'}export default {components: {VChart,VLine,VArea,VTooltip,VLegend,VBar,VPie,VScale},data () {return {legendOptions: {position: 'right',itemFormatter (val) {return val + ' ' + map[val]}},yOptions: {formatter (val) {return val * 100 + '%'}},map,data: [{ name: '芳华', percent: 0.4, a: '1' },{ name: '妖猫传', percent: 0.2, a: '1' },{ name: '机器之血', percent: 0.18, a: '1' },{ name: '心理罪', percent: 0.15, a: '1' },{ name: '寻梦环游记', percent: 0.05, a: '1' },{ name: '其他', percent: 0.02, a: '1' }]}}}</script>
 Show code
区域图(存在空值)
区域图(存在空值)
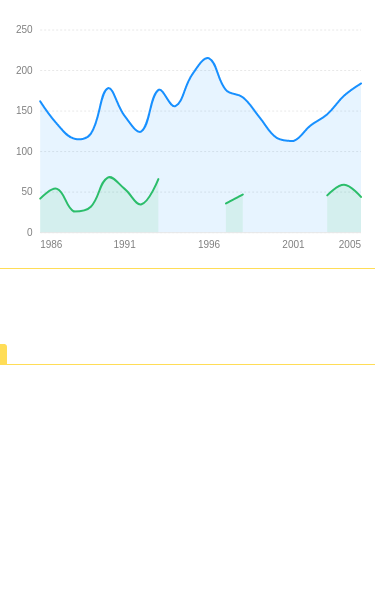
<template><div><v-chart :data="data"><v-tooltip show-crosshairs /><v-area series-field="type" shape="smooth"/><v-legend disabled /><v-line series-field="type" shape="smooth"/></v-chart></div></template><script>import { VChart, VLine, VArea, VTooltip, VLegend } from 'vux'/***[* {"year":"1986","type":"ACME","value":162},* {"year":"1986","type":"Compitor","value":42}*]*/import data from './area_empty.json'export default {components: {VChart,VLine,VArea,VTooltip,VLegend},data () {return {data}}}</script>
 Show code
散点图
散点图
<template><v-chart :data="data"><v-scale x field="height" /><v-scale y field="weight" /><v-tooltip disabled /><v-pointseries-field="gender":styles="{fillOpacity: 0.65}"></v-point></v-chart></template><script>import { VChart, VPoint, VAxis, VTooltip, VScale } from 'vux'/*** [* {"gender":"female","height":161.2,"weight":51.6},* {"gender":"female","height":167.5,"weight":59}* ]*/import data from './point.json'export default {components: {VChart,VPoint,VAxis,VTooltip,VScale},data () {return {data}}}</script>
 Show code
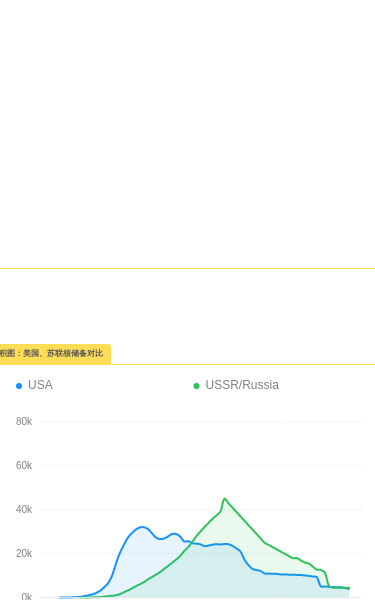
对比面积图:美国、苏联核储备对比
对比面积图:美国、苏联核储备对比
<template><div><v-chart :data="data"><v-scale x field="year" /><v-scale y field="value" :min="0" :tick-count="5" /><v-area shape="smooth" series-field="country" /><v-line shape="smooth" series-field="country" /><v-tooltip show-value-in-legend /><v-axis y :label="labelFormat"/></v-chart></div></template><script>import { VChart, VLine, VArea, VTooltip, VScale, VAxis } from 'vux'/*** [* {"country":"USSR/Russia","value":4500,"year":2016},* {"country":"USSR/Russia","value":4500,"year":2017}* ]*/import data from './area_compare.json'export default {components: {VChart,VLine,VArea,VTooltip,VScale,VAxis},data () {return {labelFormat: function (text) {return {text: text / 1000 + 'k'}},data}}}</script>
 Show code
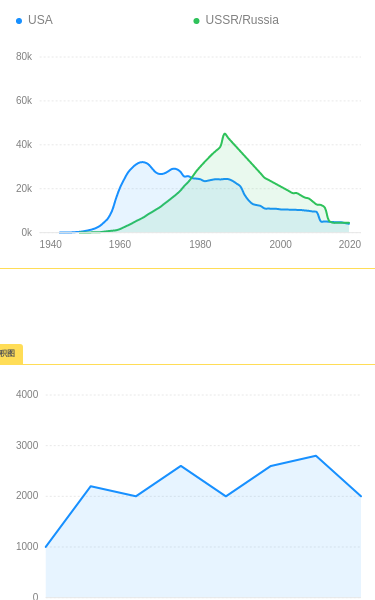
基础面积图
基础面积图
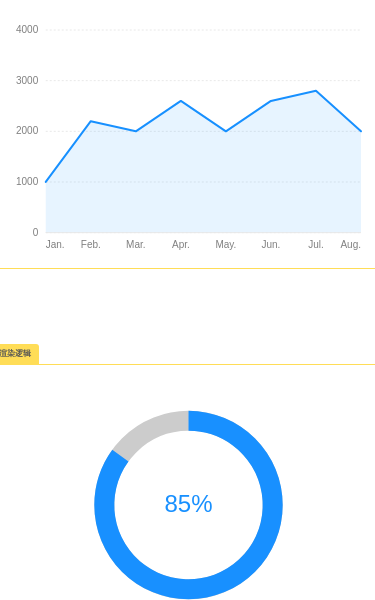
<template><div><v-chart :data="data"><v-scale x :tick-count="0" /><v-scale y :min="0" /><v-tooltip show-crosshairs show-x-value/><v-area /><v-line /></v-chart></div></template><script>import { VChart, VLine, VArea, VTooltip, VScale, VAxis } from 'vux'export default {components: {VChart,VLine,VArea,VTooltip,VScale,VAxis},data () {return {data: [{ time: 'Jan.', tem: 1000 },{ time: 'Feb.', tem: 2200 },{ time: 'Mar.', tem: 2000 },{ time: 'Apr.', tem: 2600 },{ time: 'May.', tem: 2000 },{ time: 'Jun.', tem: 2600 },{ time: 'Jul.', tem: 2800 },{ time: 'Aug.', tem: 2000 }]}}}</script>
 Show code
自定义渲染逻辑
自定义渲染逻辑
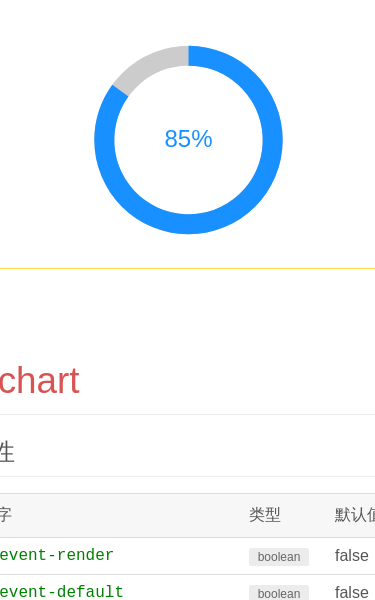
<template><div><v-chartprevent-render@on-render="renderChart"></v-chart></div></template><script>import { VChart } from 'vux'export default {components: {VChart},methods: {renderChart ({ chart }) {const data = [ { x: '1', y: 85 } ]chart.source(data, {y: {max: 100,min: 0}})chart.axis(false)chart.tooltip(false)chart.coord('polar', {transposed: true,innerRadius: 0.8,radius: 0.85})chart.guide().arc({start: [ 0, 0 ],end: [ 1, 99.98 ],top: false,style: {lineWidth: 20,stroke: '#ccc'}})chart.guide().text({position: [ '50%', '50%' ],content: '85%',style: {fontSize: 24,fill: '#1890FF'}})chart.interval().position('x*y').size(20).animate({appear: {duration: 1200,easing: 'cubicIn'}})chart.render()}}}</script>
 Show code
v-chart
v-chart
属性
| 名字 | 类型 | 默认值 | 说明 | 版本要求 |
| prevent-render | boolean | false | 是否自定义渲染逻辑 | v2.9.1 |
| prevent-default | boolean | false | 是否阻止默认行为 | v2.9.1 |
事件
| 名字 | 参数 | 说明 | 版本要求 |
| @on-render | ({ chart }) | 渲染前触发,一般用于配合 prevent-render 自定义渲染逻辑 | v2.9.1 |
方法
| 名字 | 参数 | 说明 | 版本要求 |
| rerender | 清除并重新渲染 | v2.9.1 | |
| repaint | 重新渲染 | v2.9.1 | |
| destroy | 销毁图表,canvas dom 元素不会销毁 | v2.9.1 |
v-line
v-line
属性
| 名字 | 类型 | 默认值 | 说明 | 版本要求 |
| shape | string | 线条形状,可选值 line(默认), smooth(平滑线), dash(虚线) | v2.9.1 | |
| series-field | string | 用于绘制多组线条时的分组字段名。该属性相当于 F2 里的 color,出于理解和设置方便使用 series-field | v2.9.1 | |
| colors | stringarray | 线条颜色,可以为单个颜色或者颜色列表。不指定时使用默认颜色。 | v2.9.1 |
v-area
v-area
属性
| 名字 | 类型 | 默认值 | 说明 | 版本要求 |
| series-field | string | 用于绘制多组线条时的分组字段名。该属性相当于 F2 里的 color,出于理解和设置方便使用 series-field | v2.9.1 | |
| colors | stringarray | 线条颜色,可以为单个颜色或者颜色列表。不指定时使用默认颜色。 | v2.9.1 |
v-bar
v-bar
属性
| 名字 | 类型 | 默认值 | 说明 | 版本要求 |
| colors | stringarray | 线条颜色,可以为单个颜色或者颜色列表。不指定时使用默认颜色。 | v2.9.1 |
v-pie
v-pie
v-point
v-point
v-scale
v-scale
属性
| 名字 | 类型 | 默认值 | 说明 | 版本要求 |
| field | string | [组件属性]指定 坐标轴 字段。对于简单数据,VChart 可以判断使用哪个字段,但是如果顺序不确定或者多字段的数据,最好手动指定。 | v2.9.1 | |
| x | boolean | [组件属性]是否为 x轴 配置。 | v2.9.1 | |
| y | boolean | [组件属性]是否为 y轴 配置。 | v2.9.1 | |
| type | string | 指定不同的度量类型,支持的 type 为 identity、linear、cat、timeCat。 | v2.9.1 | |
| formatter | function | 回调函数,用于格式化坐标轴刻度点的文本显示,会影响数据在坐标轴 axis、图例 legend、提示信息 tooltip 上的显示。 | v2.9.1 | |
| range | array | [0, 1] | 输出数据的范围,默认[0, 1],格式为 [min, max],min 和 max 均为 0 至 1 范围的数据。 | v2.9.1 |
| alias | string | 该数据字段的显示别名,一般用于将字段的英文名称转换成中文名(tooltip 中显示)。 | v2.9.1 | |
| tick-count | number | 5 | 坐标轴上刻度点的个数,设为 0 时表示全部显示。 | v2.9.1 |
| ticks | array | 用于指定坐标轴上刻度点的文本信息,当用户设置了 ticks 就会按照 ticks 的个数和文本来显示。如 [ 0, 50, 100, 150, 200, 300, 500 ] | v2.9.1 |
v-axis
v-axis
属性
| 名字 | 类型 | 默认值 | 说明 | 版本要求 |
| disabled | boolean | 禁用当前坐标轴。 | v2.9.1 | |
| x | boolean | [组件属性]是否为 x轴 配置。 | v2.9.1 | |
| y | boolean | [组件属性]是否为 y轴 配置。 | v2.9.1 |
v-guide
v-guide
属性
| 名字 | 类型 | 默认值 | 说明 | 版本要求 |
| type | string | 辅助元素类型,可以为 line, text, tag, rect, html, arc | v2.9.1 | |
| options | object | 辅助元素属性对象。你也可以在 template 里将属性分开写,不需要使用该 prop,同时使用时属性会被合并。 | v2.9.1 |
重要提示及已知问题
## 重要提示及已知问题
- Q全局设置分辨率(devicePixelRatio)
// 入口文件处设置
Vue.prototype.$devicePixelRatio = 2
- Q自定义渲染行为
在面对复杂的渲染逻辑时,直接使用组件无法满足。此时可以这样处理:
<v-chart
  prevent-render
  @on-render="renderVChart"></v-chart>
methods: {
  renderVChart ({ chart }) {
    // do what you want
  }
}
- Q修改子组件配置不会自动刷新
是的,考虑到移动端更多是展示而不是操作,暂时不支持自动刷新。
- Q为什么我自己封装时会报错
要先了解 Vue 组件的生命周期,在 canvas 元素未 mounted 前 F2 无法正确渲染。
mounted () {
  this.$nextTick(( => {
    // do what you want with F2
  })
}
v-tooltip
## v-tooltip
## 属性
| 名字 | 类型 | 默认值 | 说明 | 版本要求 |
| disabled | boolean | false | [快捷属性,非 F2 原有属性]是否禁用 tooltip, 相当于调用chart.tooltip(false) | v2.9.1 |
| show-x-value | boolean | false | [快捷属性,非 F2 原有属性]用于单折线的情况,设定是否将 x 轴值显示在 tooltip 里,默认是 xLabel:yValue 的形式(value:23),启用将变成 xValue:yValue 的形式(2017-01-01:23),建议在 tickCount 无法完全显示时启用。该设置会覆盖原有 onShow 设置。 | v2.9.1 |
| show-value-in-legend | boolean | false | [快捷属性,非 F2 原有属性]是否禁用默认 tooltip 而是显示在 legend 里。适用于有分组(series-field)情况。 | v2.9.1 |
v-legend
v-legend
属性
| 名字 | 类型 | 默认值 | 说明 | 版本要求 |
| disabled | boolean | false | [快捷属性,非 F2 原有属性]是否禁用 legend, 相当于调用chart.legend(false) | v2.9.1 |
v-guide
v-guide
属性
| 名字 | 类型 | 默认值 | 说明 | 版本要求 |
| type | string | 辅助元素类型,可以为 line, text, tag, rect, html, arc | v2.9.1 | |
| options | object | 辅助元素属性对象。你也可以在 template 里将属性分开写,不需要使用该 prop,同时使用时属性会被合并。 | v2.9.1 |
重要提示及已知问题
重要提示及已知问题
- Q全局设置分辨率(devicePixelRatio)
// 入口文件处设置Vue.prototype.$devicePixelRatio = 2
- Q自定义渲染行为
在面对复杂的渲染逻辑时,直接使用组件无法满足。此时可以这样处理:
<v-chartprevent-render@on-render="renderVChart"></v-chart>
methods: {renderVChart ({ chart }) {// do what you want}}
- Q修改子组件配置不会自动刷新
是的,考虑到移动端更多是展示而不是操作,暂时不支持自动刷新。
- Q为什么我自己封装时会报错
要先了解 Vue 组件的生命周期,在 canvas 元素未 mounted 前 F2 无法正确渲染。
mounted () {this.$nextTick(( => {// do what you want with F2})}
贡献者
贡献者
该组件(包含文档)迭代次数 7,贡献人数 3
jiagangairyland黄涛
Changelog
发布日志
- 2.9.3 [enhance] v-point 可以设置size和shape, v-line 可以设置shape
