- weex-toolkit
- 安装
- 命令
- create
- preview
- compile
- 参数
- platform
- run
- debug
- 用法
- 参数
- 特性
- 连接设备
- 调试
.vue文件 - 调试文件夹中的
.vue文件 - Inspector
- Element
- NetWork
- 查看网络请求的总耗时和延时
- 查看网络请求的header和response
- 控制台
- 资源
- 调试
- Breakpoint and CallStack
- 集成devtool工具
weex-toolkit
weex-toolkit 是官方提供的一个脚手架命令行工具,你可以使用它进行 Weex 项目的创建,调试以及打包等功能。
安装
$ npm install -g weex-toolkit
如果你本地没有安装 node.js 你可以前往官网下载安装。
- 请确保你的 node 版本是>=6,你可以使用 n 来进行 node 的版本管理。
中国用户如果npm遭遇网络问题,可以使用淘宝的 npm镜像或通过nrm工具切换你的npm镜像:
$ npm install weex-toolkit -g --registry=https://registry.npm.taobao.org// 或者$ nrm use taobao$ npm install weex-toolkit -g
如果你安装的过程中遇到了问题,你可以在weex-toolkit问题汇总中找到解决方法或者在weex-toolkit issues中与我们讨论。
命令
create
$ weex create awesome-project
该命令用于创建一个新的weex项目。命令运行后,你可以找到awesome-project目录,里面有一些Weex模板,里面提供了一些内置的脚本
build: 用于打包源文件生成JS bundledev: 运行监听模式的webpack打包脚本serve: 启动热更新静态服务器
你需要在运行npm start前运行一下npm i来安装项目依赖,之后浏览器就会自动打开开发页面。
preview
weex-toolkit supports previewing your Weex file(.we or .vue) in a watch mode. You only need specify your file path.
weex-toolkit工具支持对你的Weex文件(.vue)在监听模式下进行预览,你只需要指定一下你的项目路径。
$ weex src/foo.vue
浏览器会自动得打开预览页面并且你可以看到你的weex页面的布局和效果。如果你在你的设备上安装了Playground,你还可以通过扫描页面上的二维码来查看页面。
使用下面的命令,你将可以预览整个文件夹中的.vue文件
$ weex src --entry src/foo.vue
你需要指定要预览的文件夹路径以及入口文件(通过--entry传入)。
compile
使用 weex compile 命令可以编译单个weex文件或者整个文件夹中的weex文件。
$ weex compile [source] [dist] [options]
参数
| Option | Description | |
|---|---|---|
-w, --watch |
watch we file changes auto build them and refresh debugger page! [default true] |
|
-d,--devtool [devtool] |
set webpack devtool mode | |
-e,--ext [ext] |
set enabled extname for compiler default is vue | we |
-m, --min |
set jsbundle uglify or not. [default false] |
你可以这样子使用:
$ weex compile src dest --devtool source-map -m
platform
使用weex platform [add|remove] [ios|android]命令可以添加或移除ios/android项目模板。
$ weex platform add ios$ weex platform remove ios
使用 weex platform list来查看你的项目中支持的平台。
run
你可以使用weex-toolkit来运行android/ios/web项目.
$ weex run ios$ weex run android$ weex run web
debug
Weex devtools 是实现Chrome调试协议的Weex自定义开发工具,
主要用于帮助你快速检查您的应用程序,并在Chrome网页中调试您的JS bundle源代码,支持Android和iOS平台。所以你可以通过weex-toolkit使用的weex-devtool功能。
用法
weex debug [we_file|bundles_dir] [options]
参数
| Option | Description | |||||
|---|---|---|---|---|---|---|
-V, --verbose |
display logs of debugger server | |||||
-v, --version |
display version | |||||
-p, --port [port] |
set debugger server port | |||||
-e, --entry [entry] |
set the entry bundlejs path when you specific the bundle server root path | |||||
-m, --mode [mode] |
set build mode [transformer | loader] | ||||
-w, --watch |
watch we file changes auto build them and refresh debugger page! [default true] |
|||||
--ip [ip] |
set the host ip of debugger server | |||||
--loglevel [loglevel] |
set log level `silent | error | warn | info | log | debug` |
--min |
set jsbundle uglify or not. [default false] |
|||||
--debug |
start with node-inspect default port is 9331 |
特性
连接设备
$ weex debug
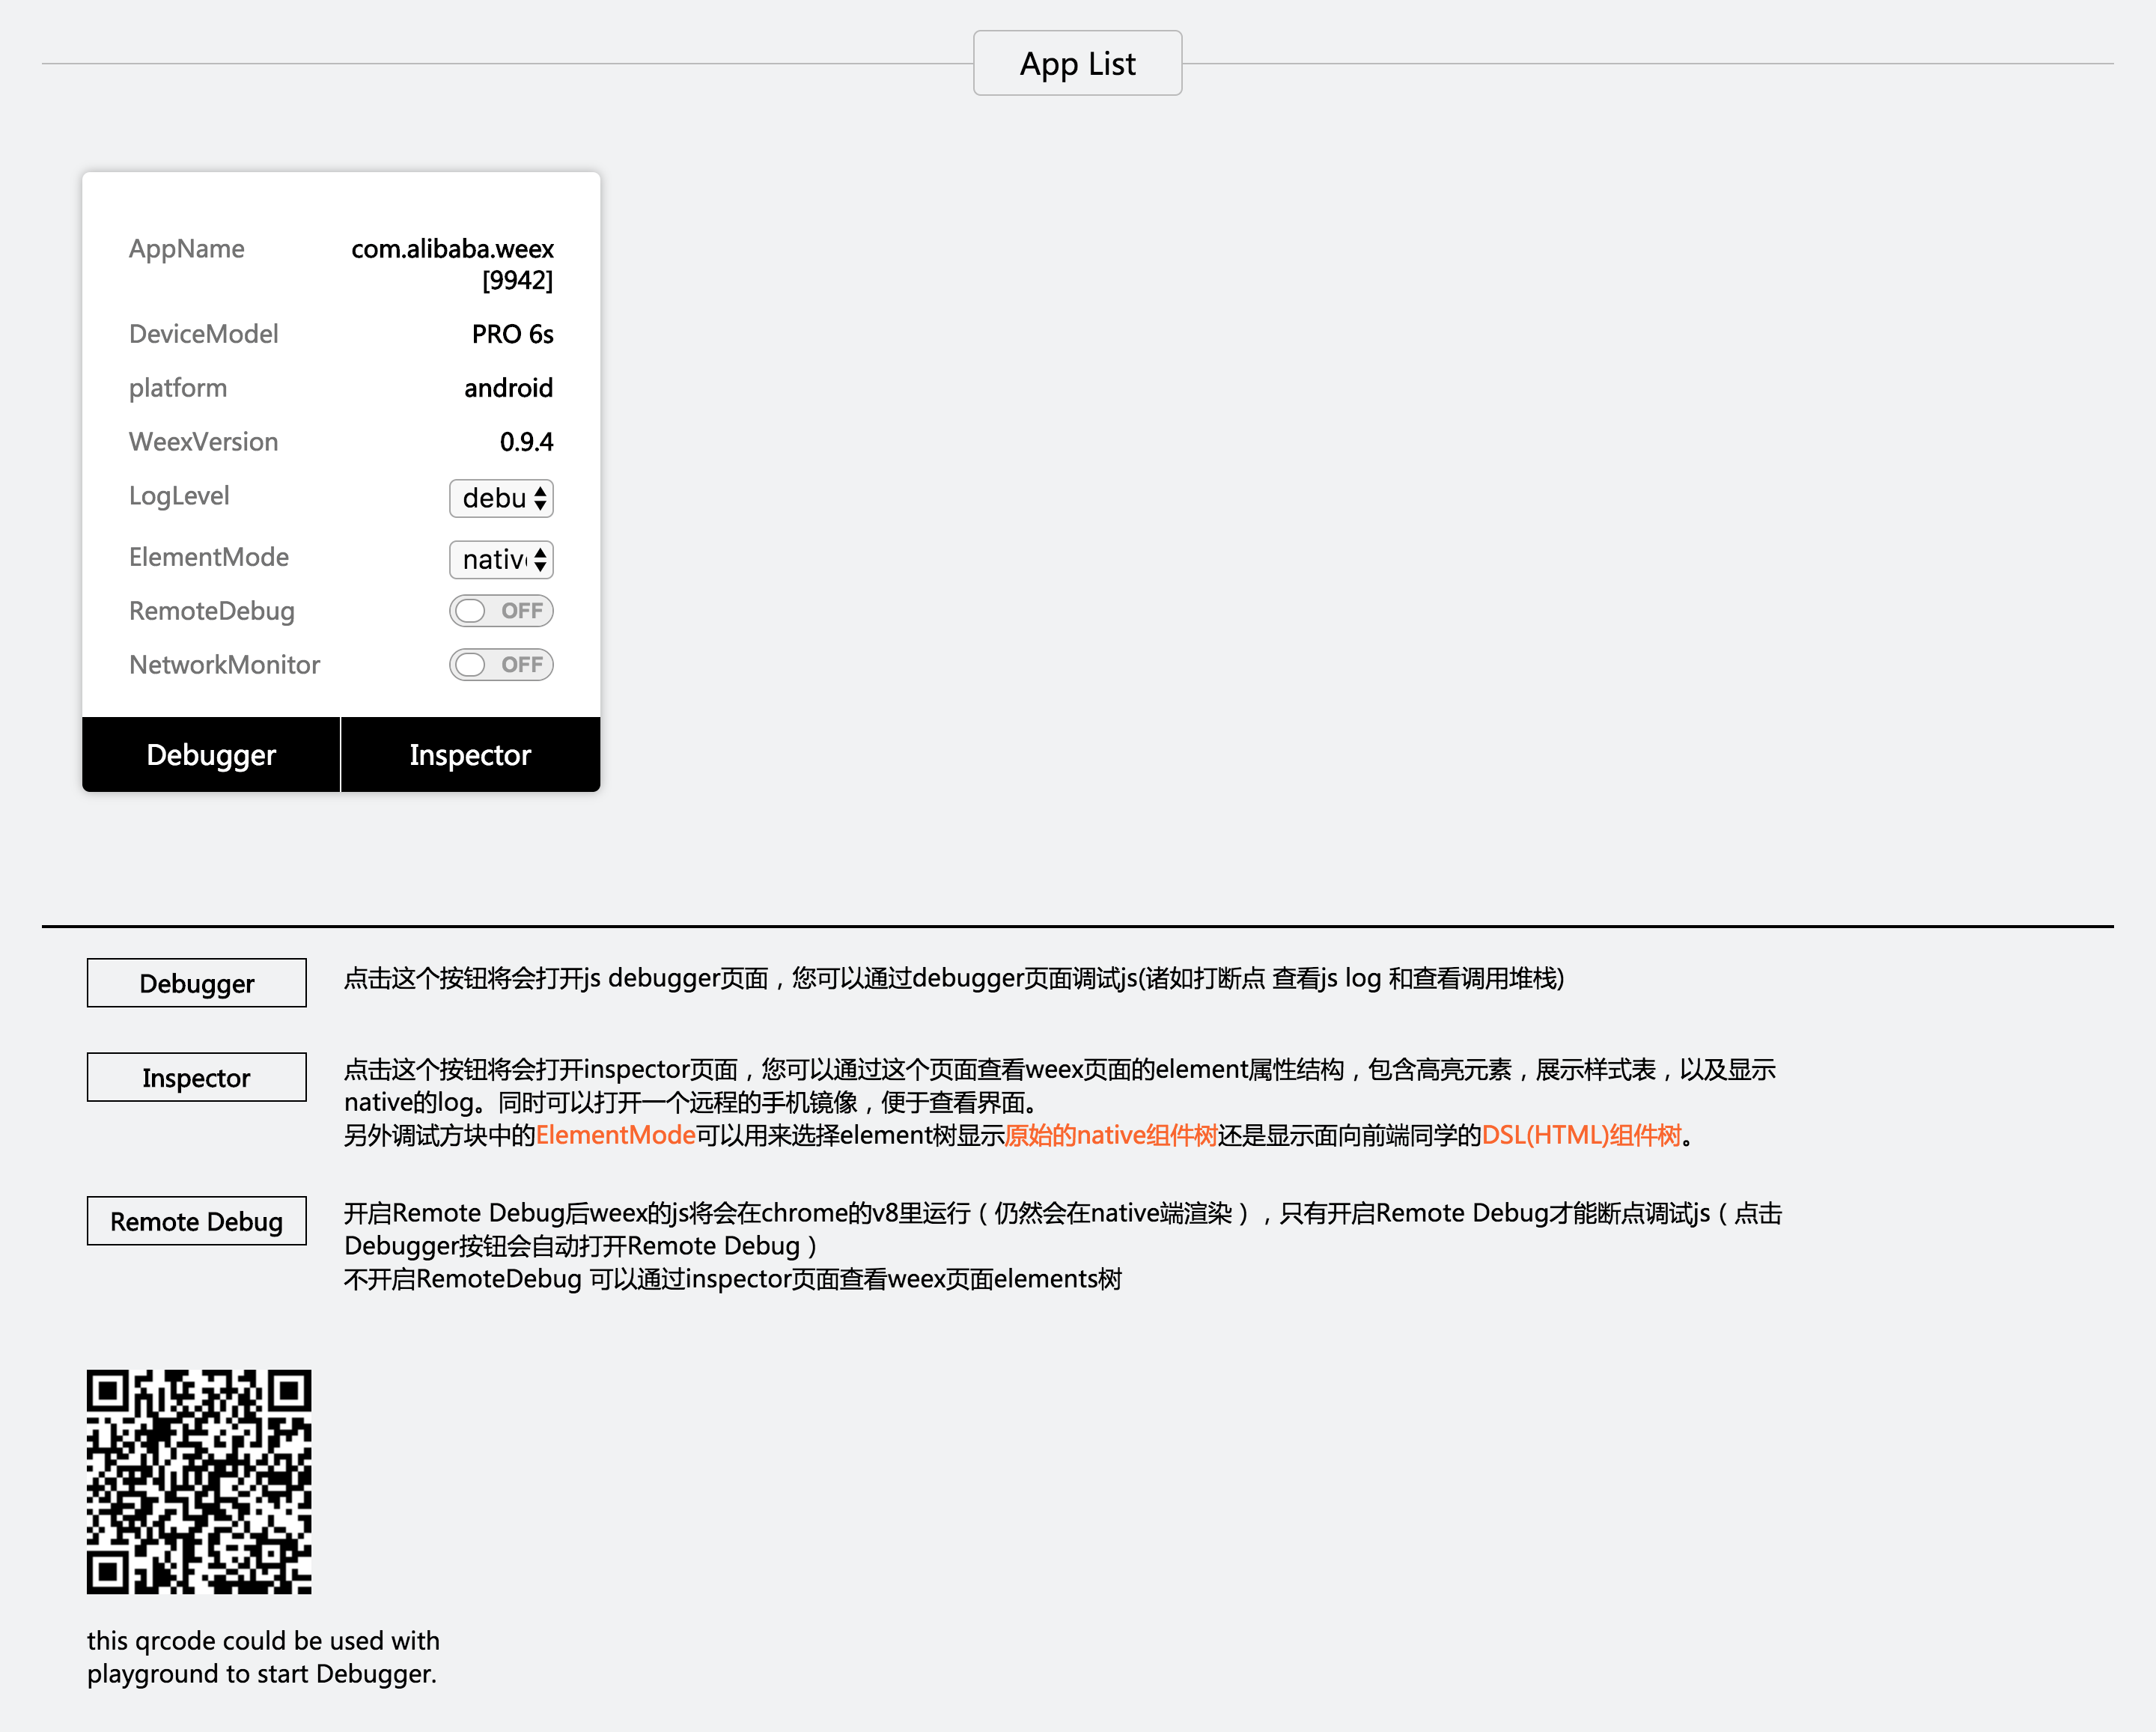
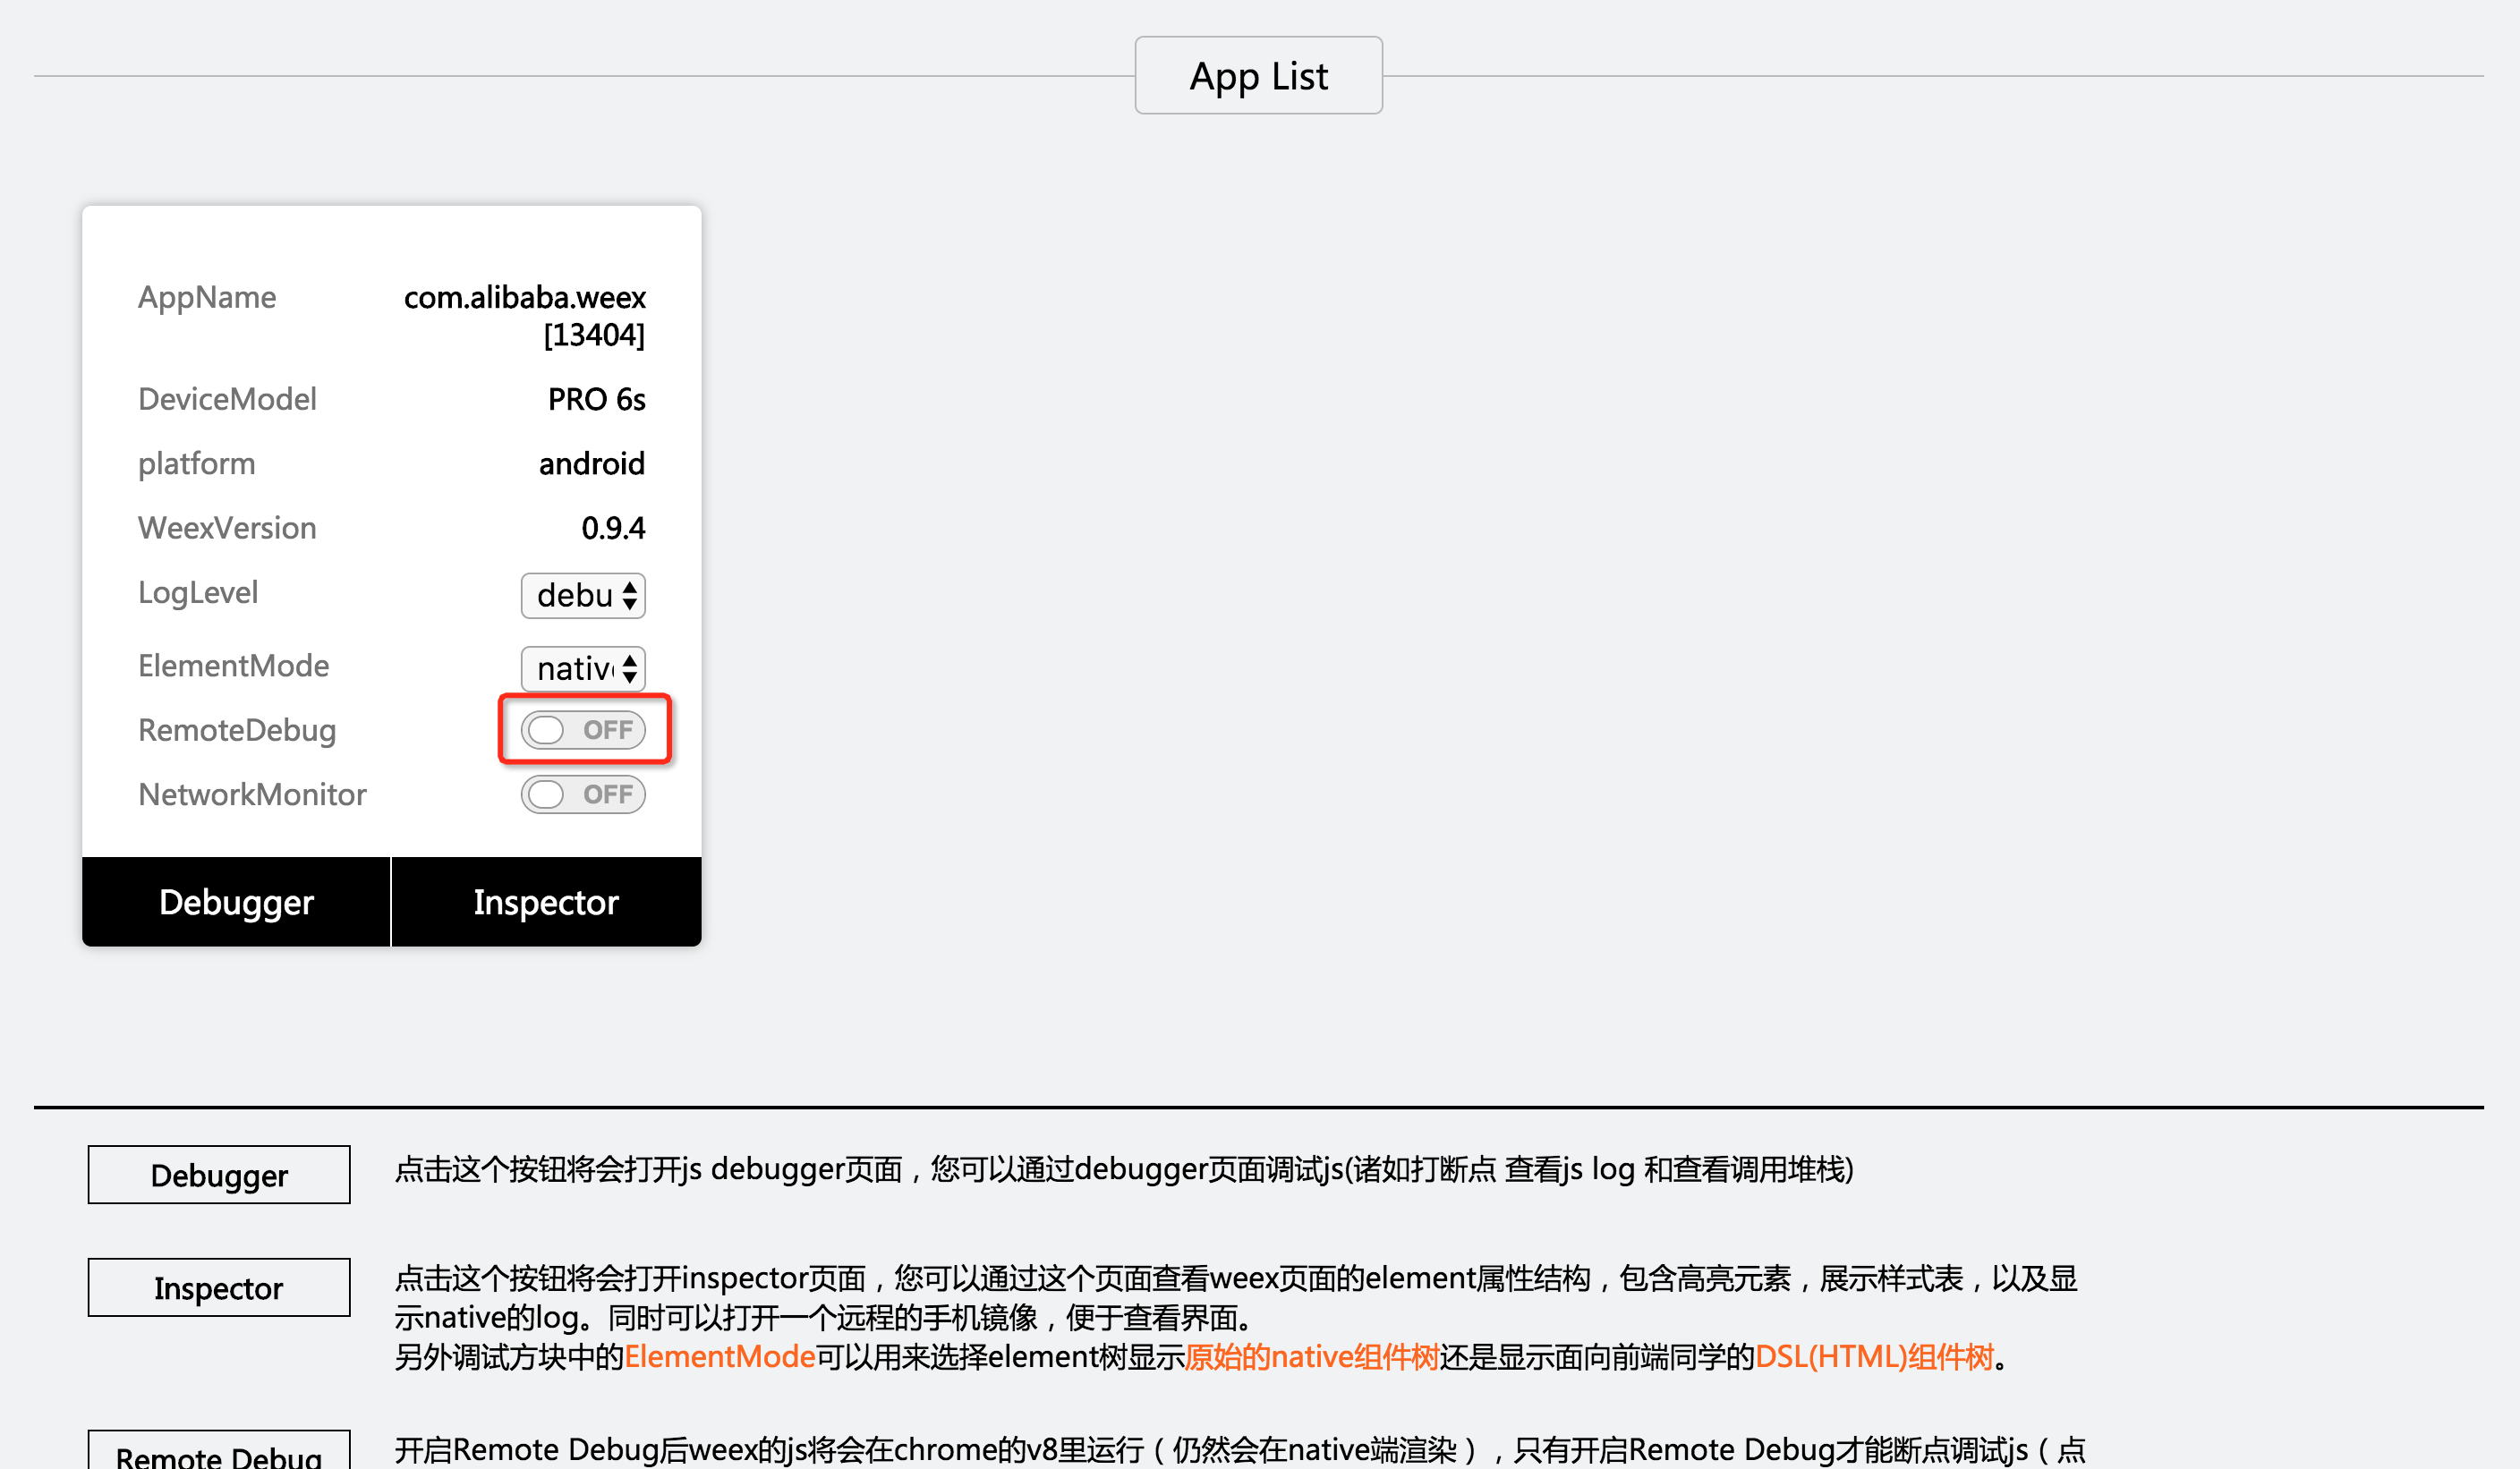
这个命令将启动调试服务器并启动一个打开“DeviceList”页面的chrome。
这个页面会显示一个二维码,你可以使用Playground来扫描它来启动调试或者在你的应用中集成Weex devtools
调试.vue文件
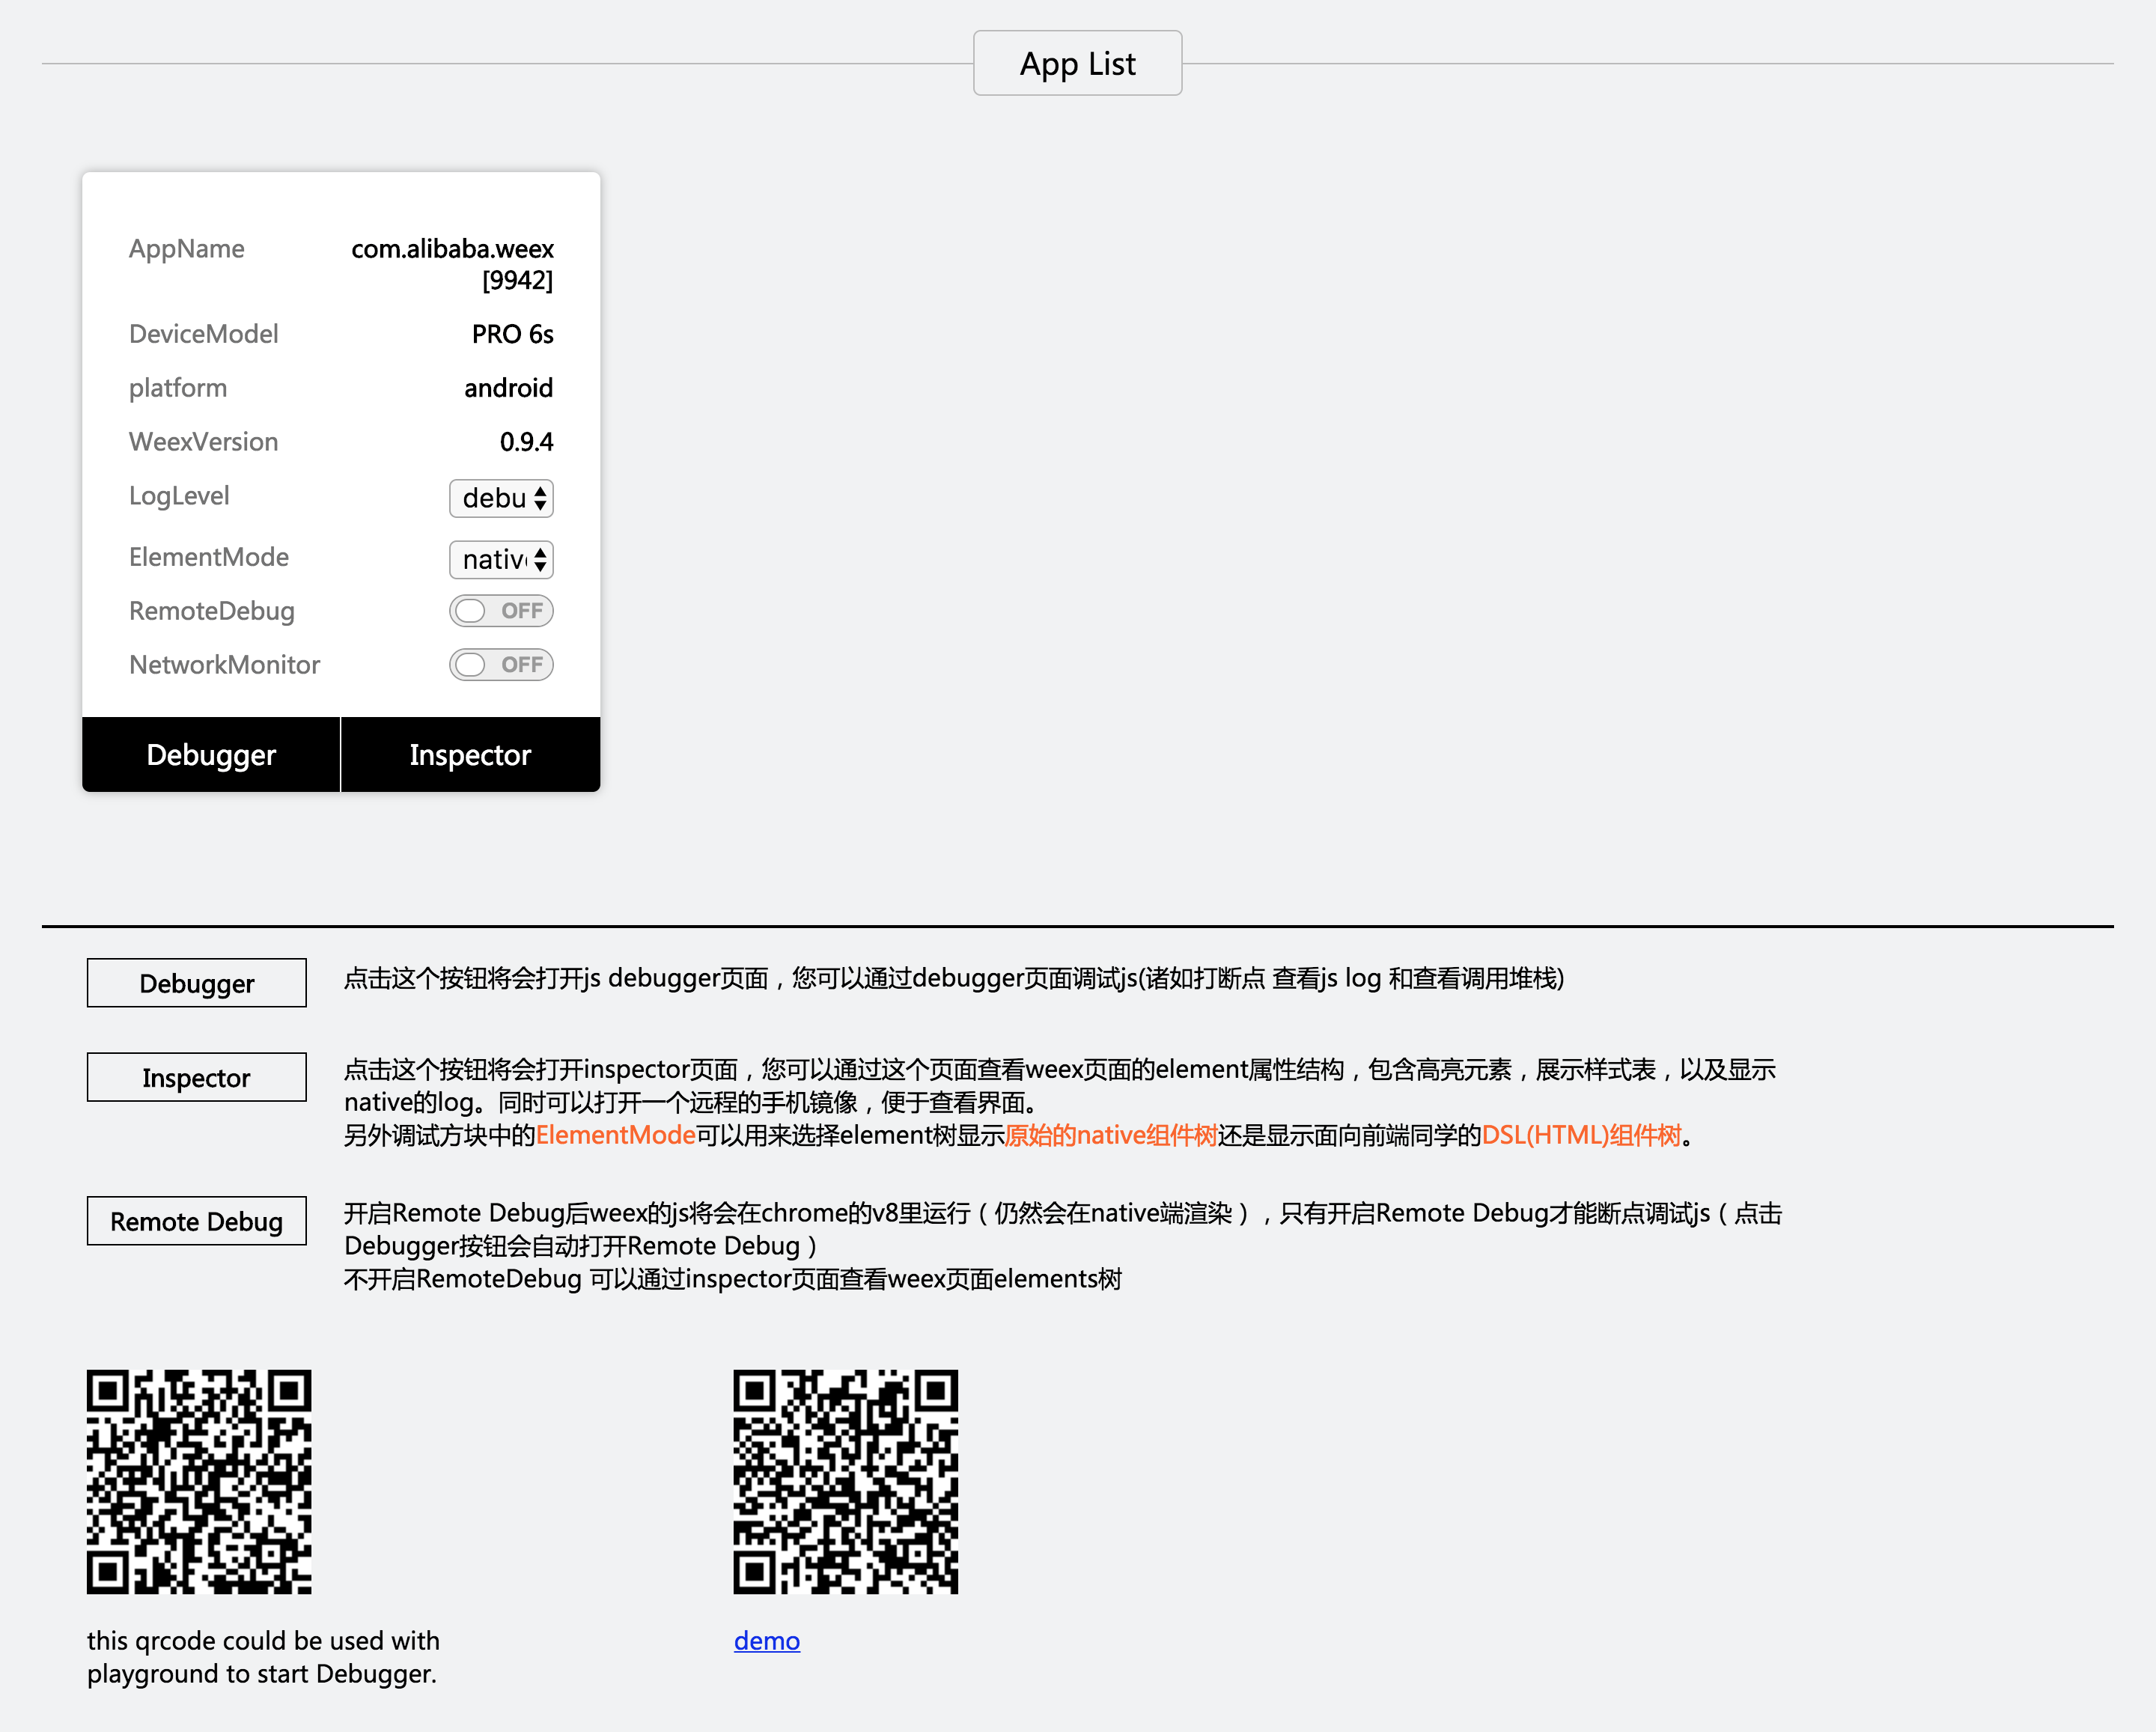
$ weex debug your_weex.vue
这个命令会将your_weex.vue编译成your_weex.js,并根据命令启动调试服务器。your_weex.js将部署在服务器上并显示在调试页面中,使用另一个二维码用于your_weex.js文件的调试。
调试文件夹中的.vue文件
$ weex debug your/vue/path -e index.vue
这个命令将编译your/vue/path中的每个文件,并将它们部署在捆绑服务器上,新的文件将映射到http://localhost:port/weex/路径下,使用-e指定的路径作为页面的入口。
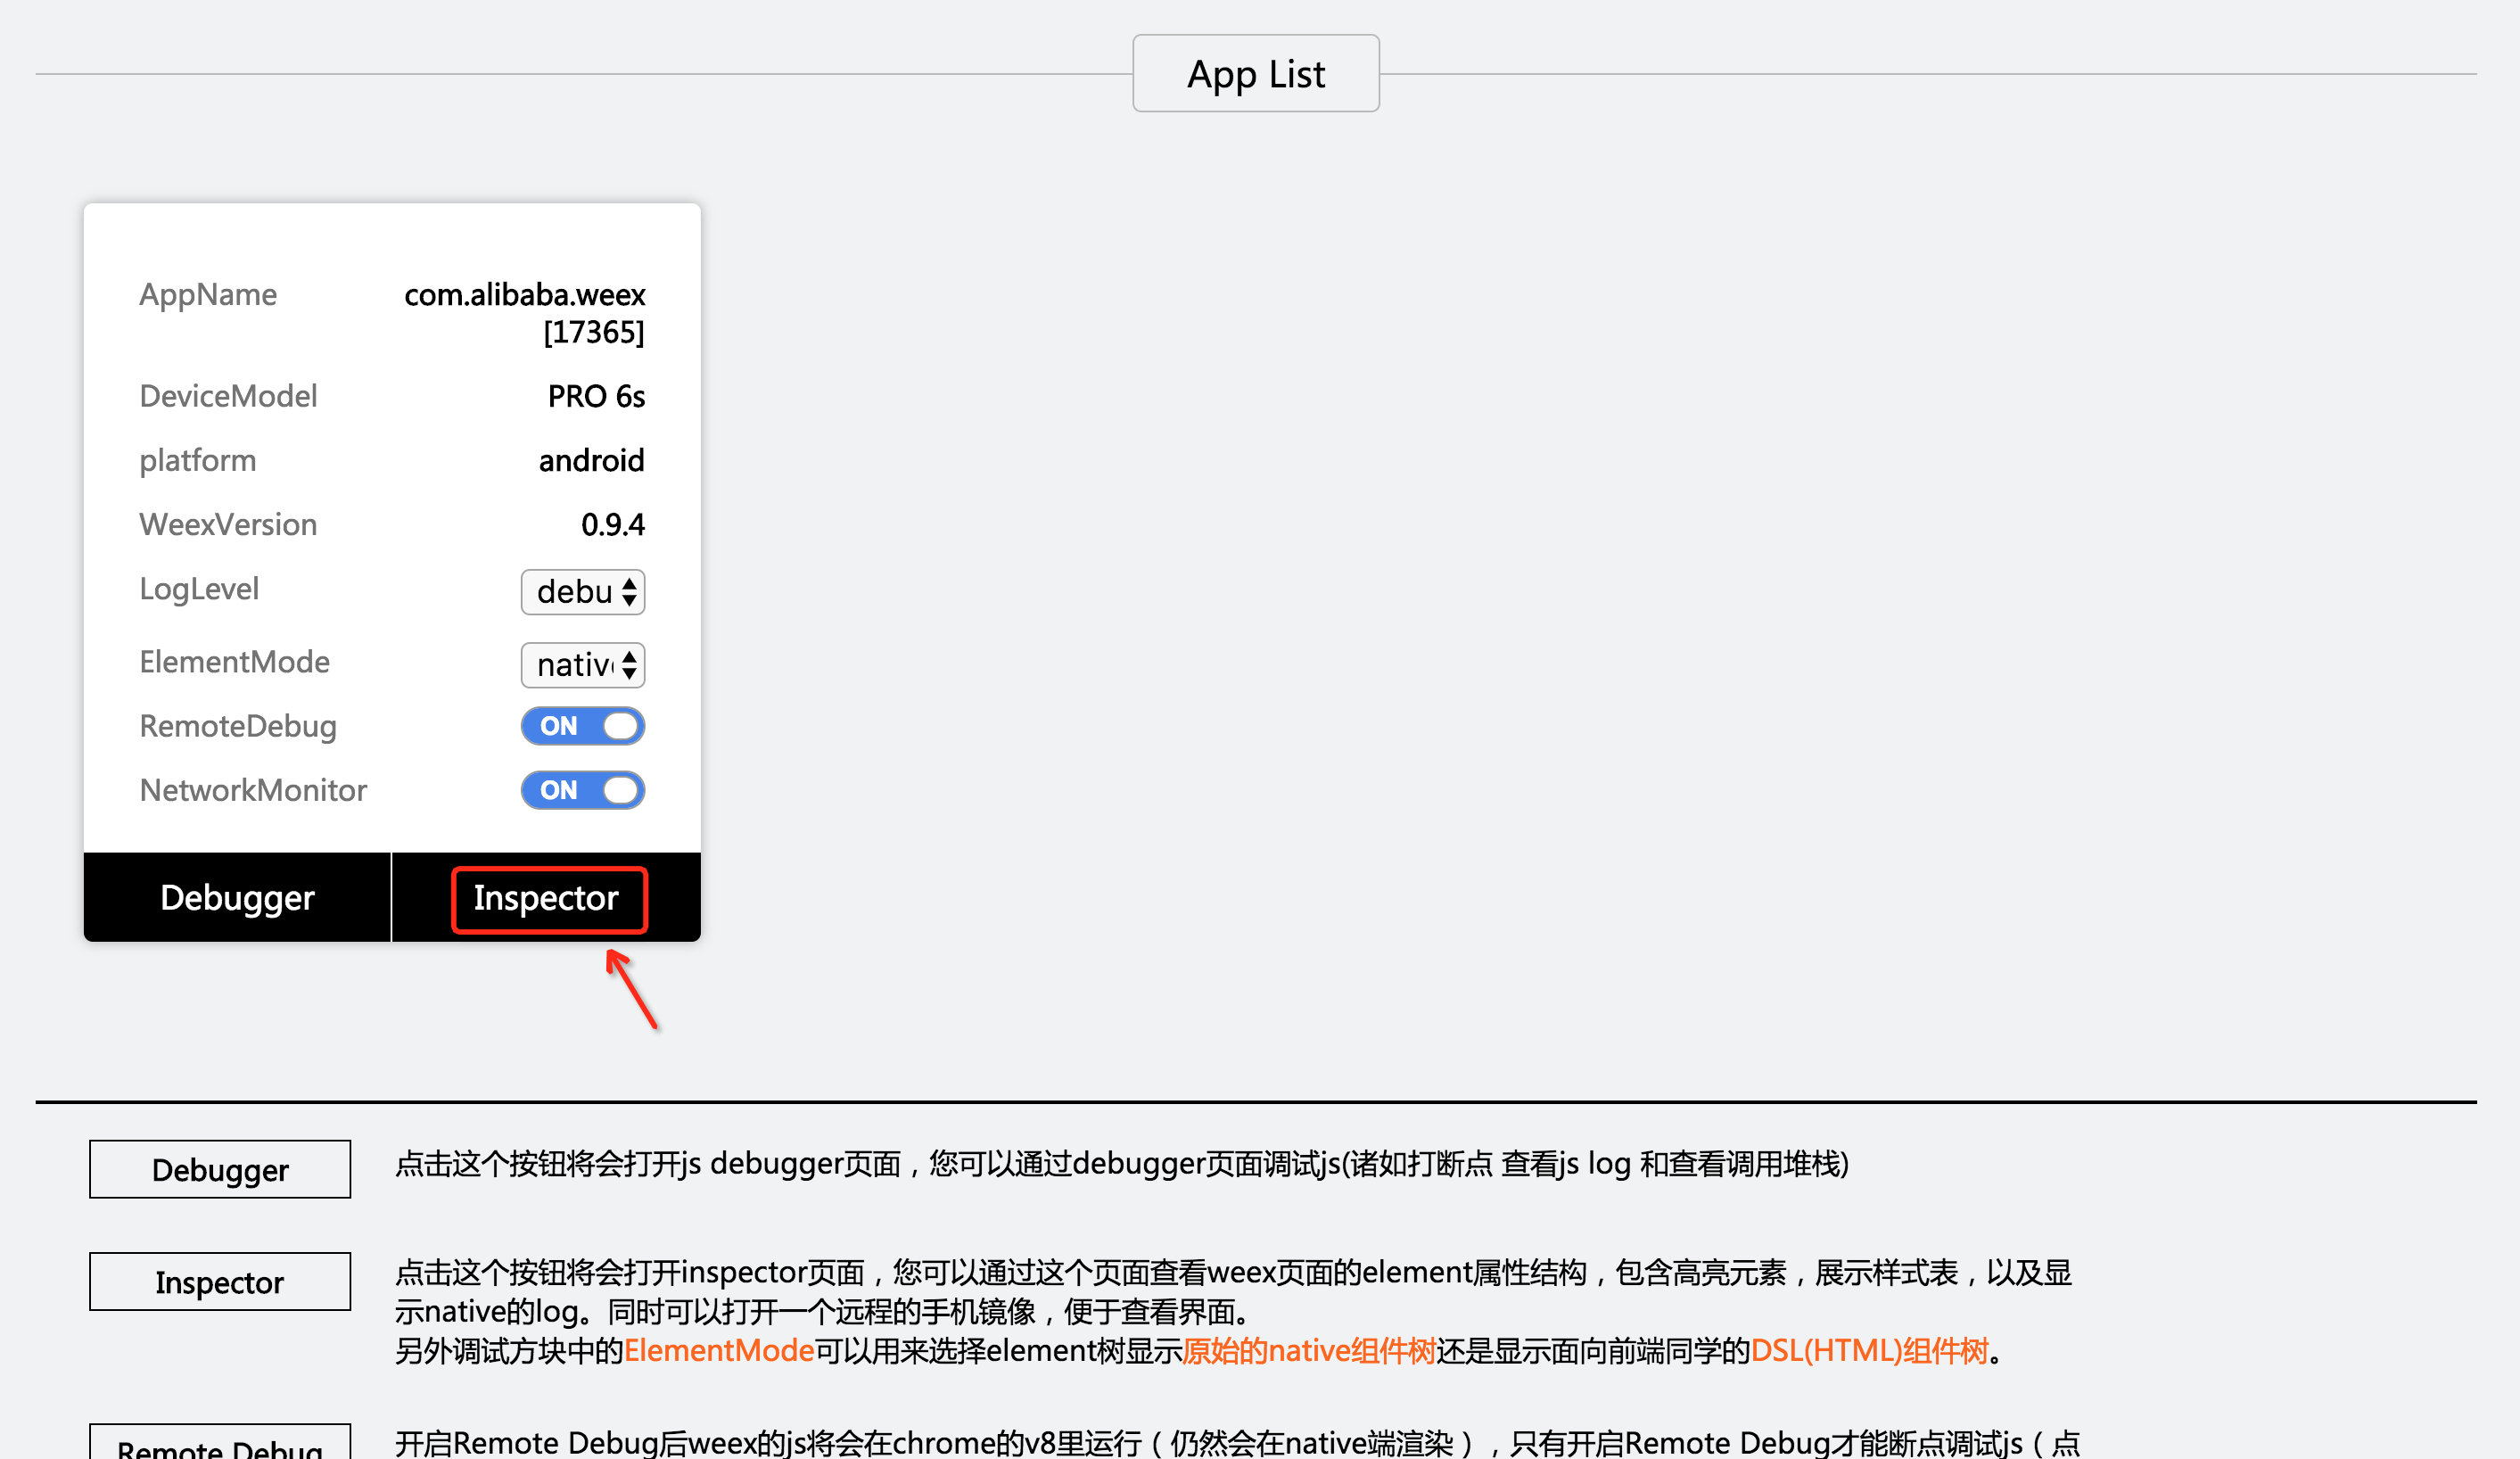
Inspector
Inspector 能够用来查看 Element \ NetWork \ Console log \ ScreenCast \ BoxModel \ Native View 等。
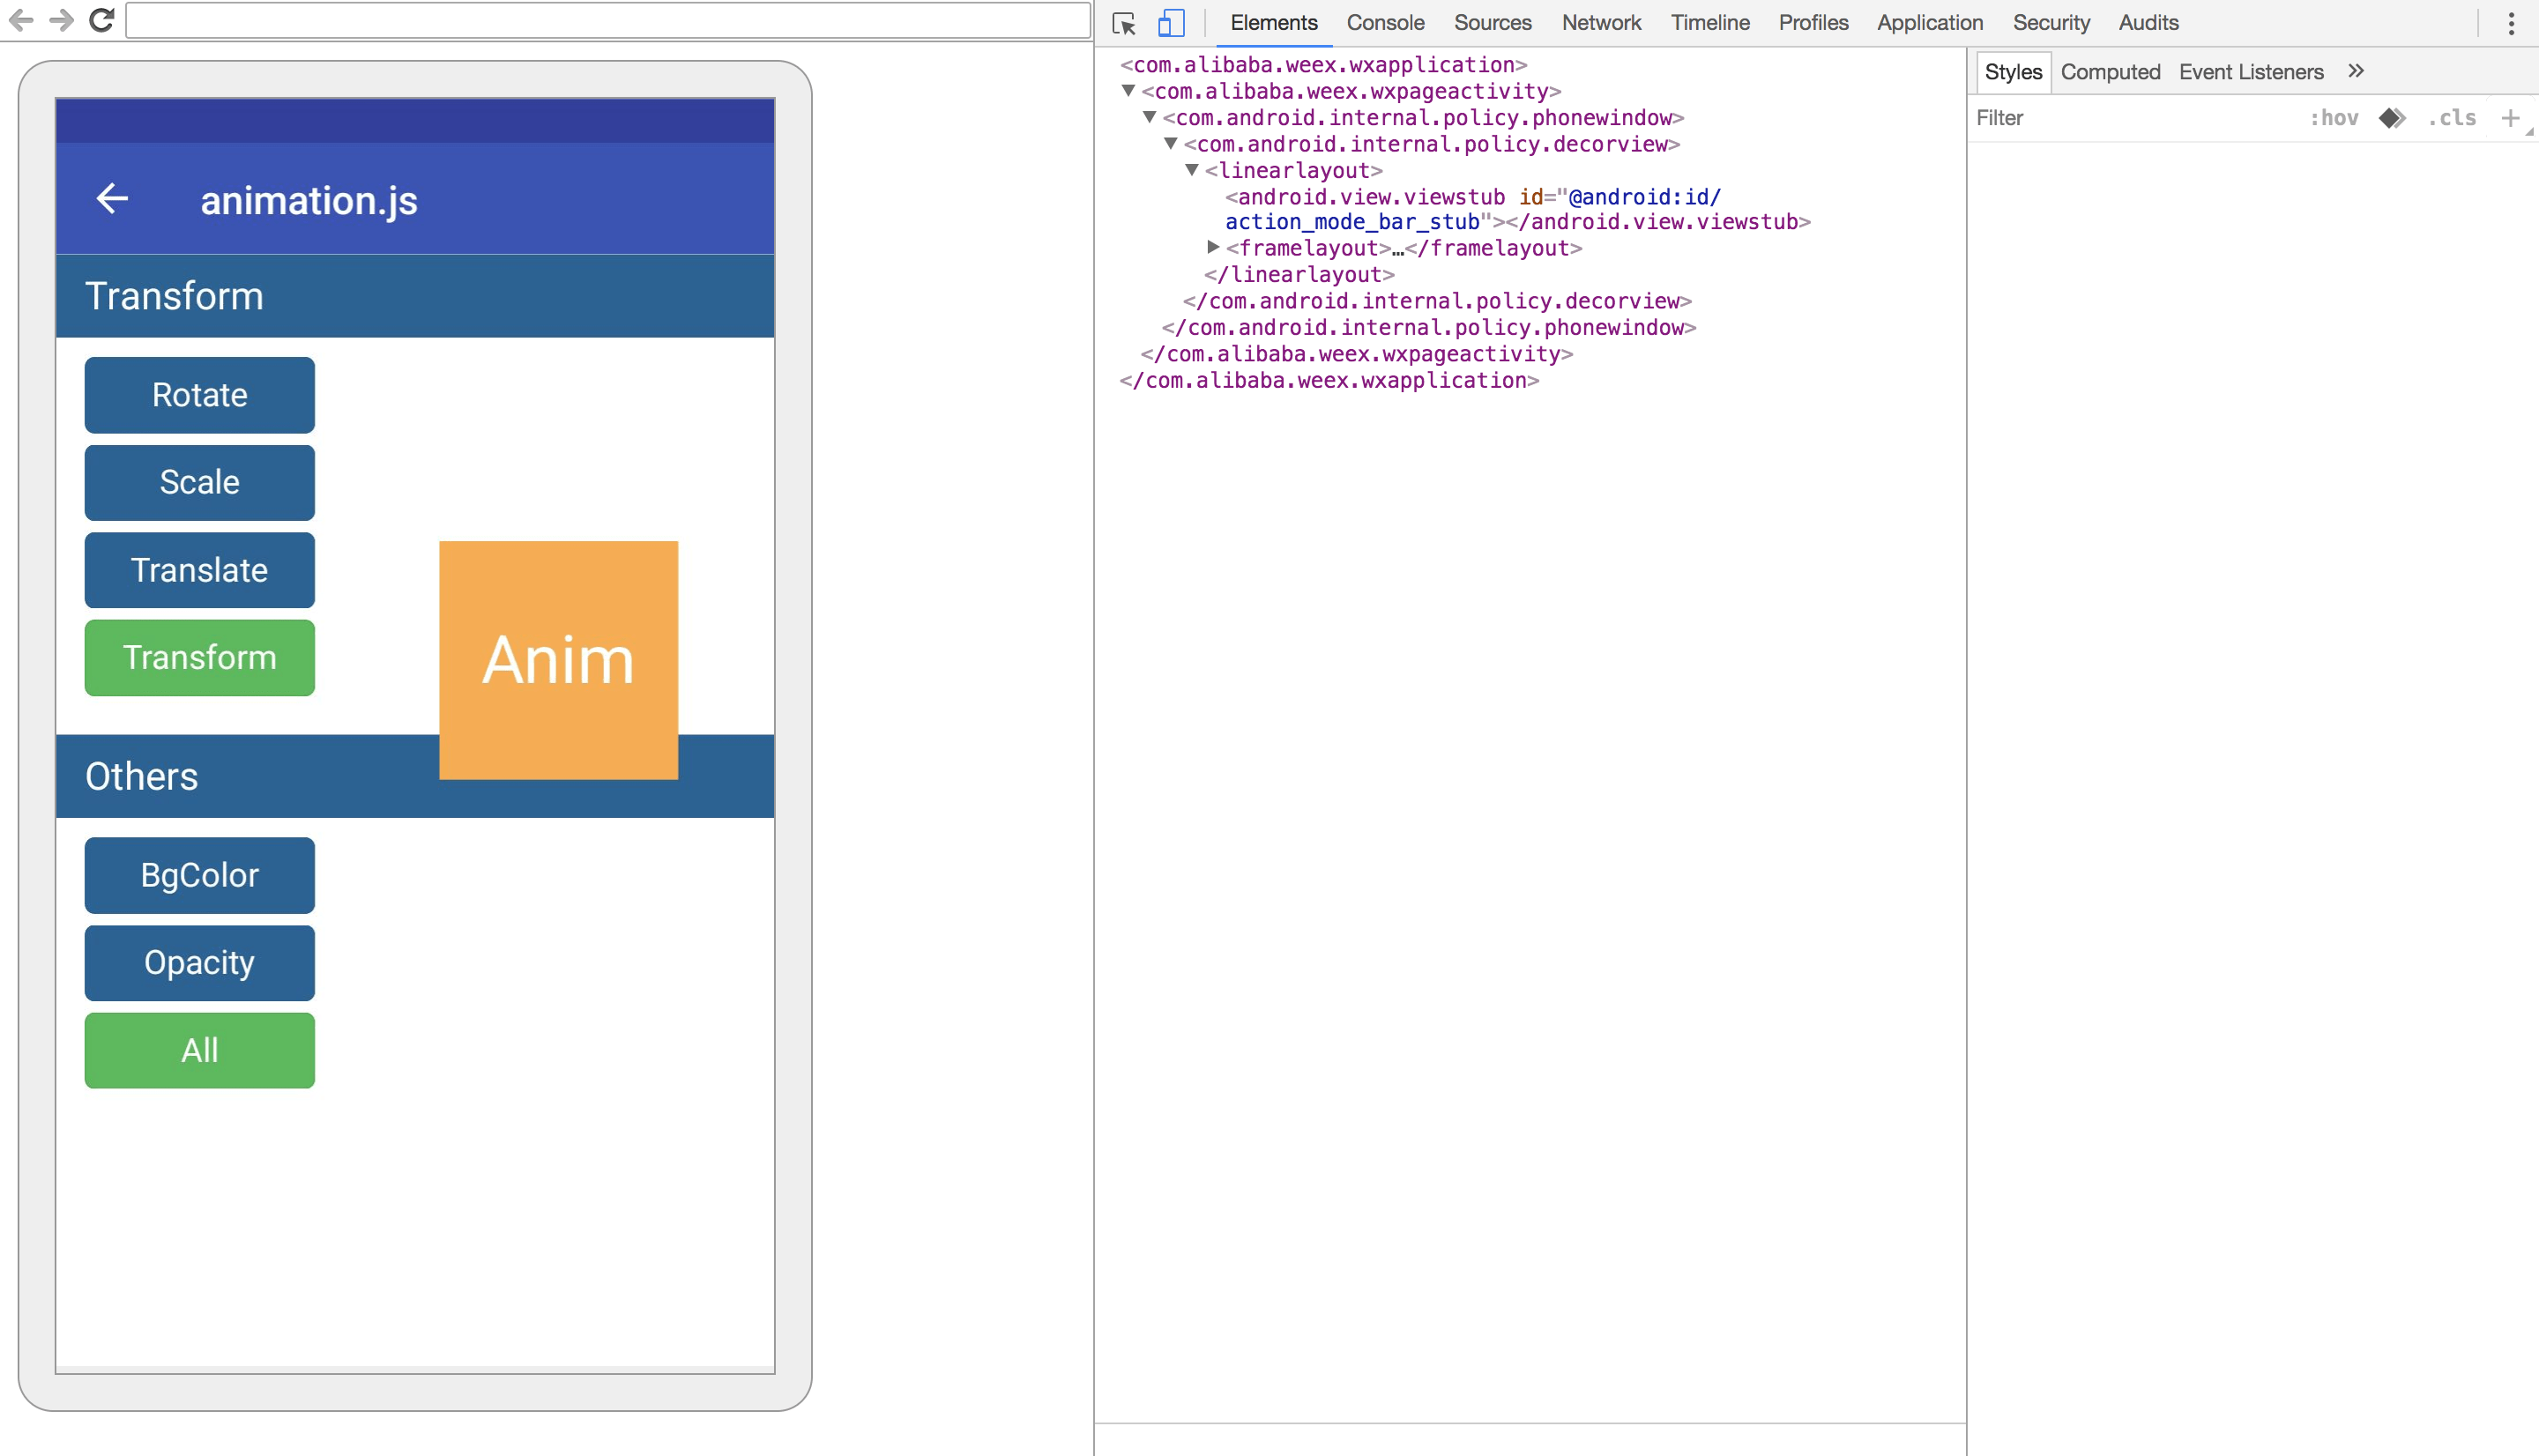
Element
NetWork
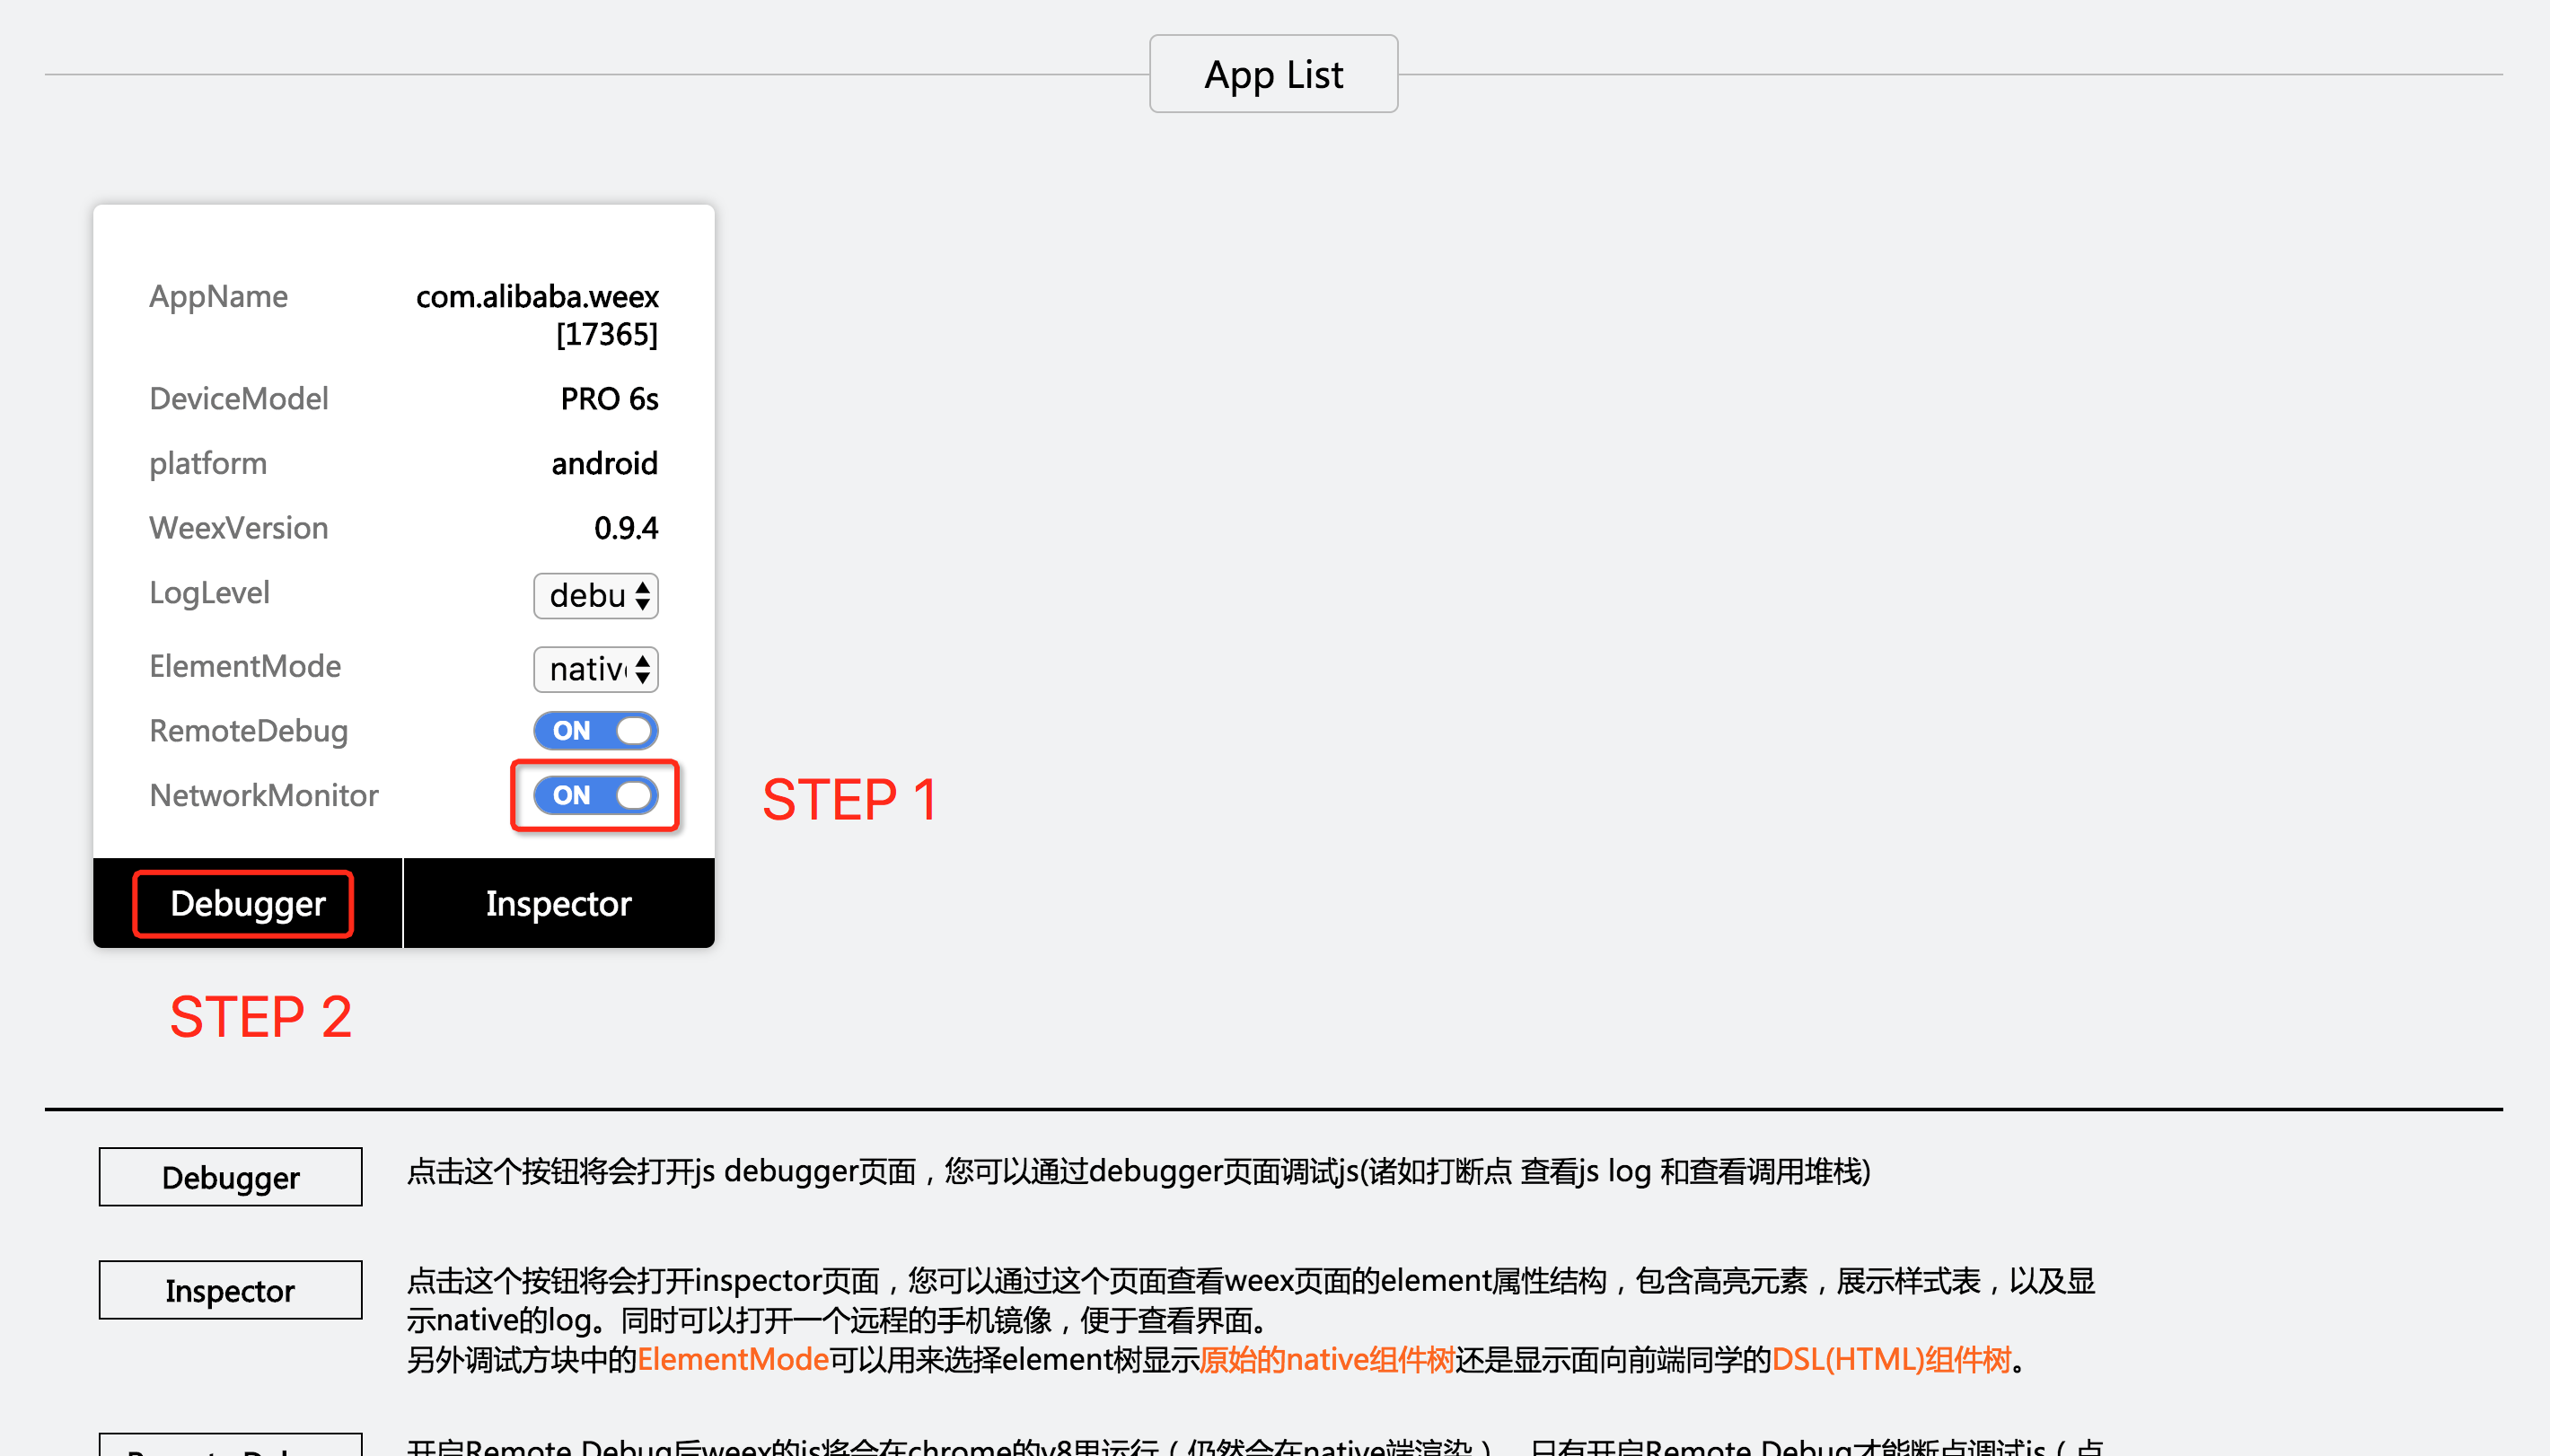
查看网络请求的总耗时和延时
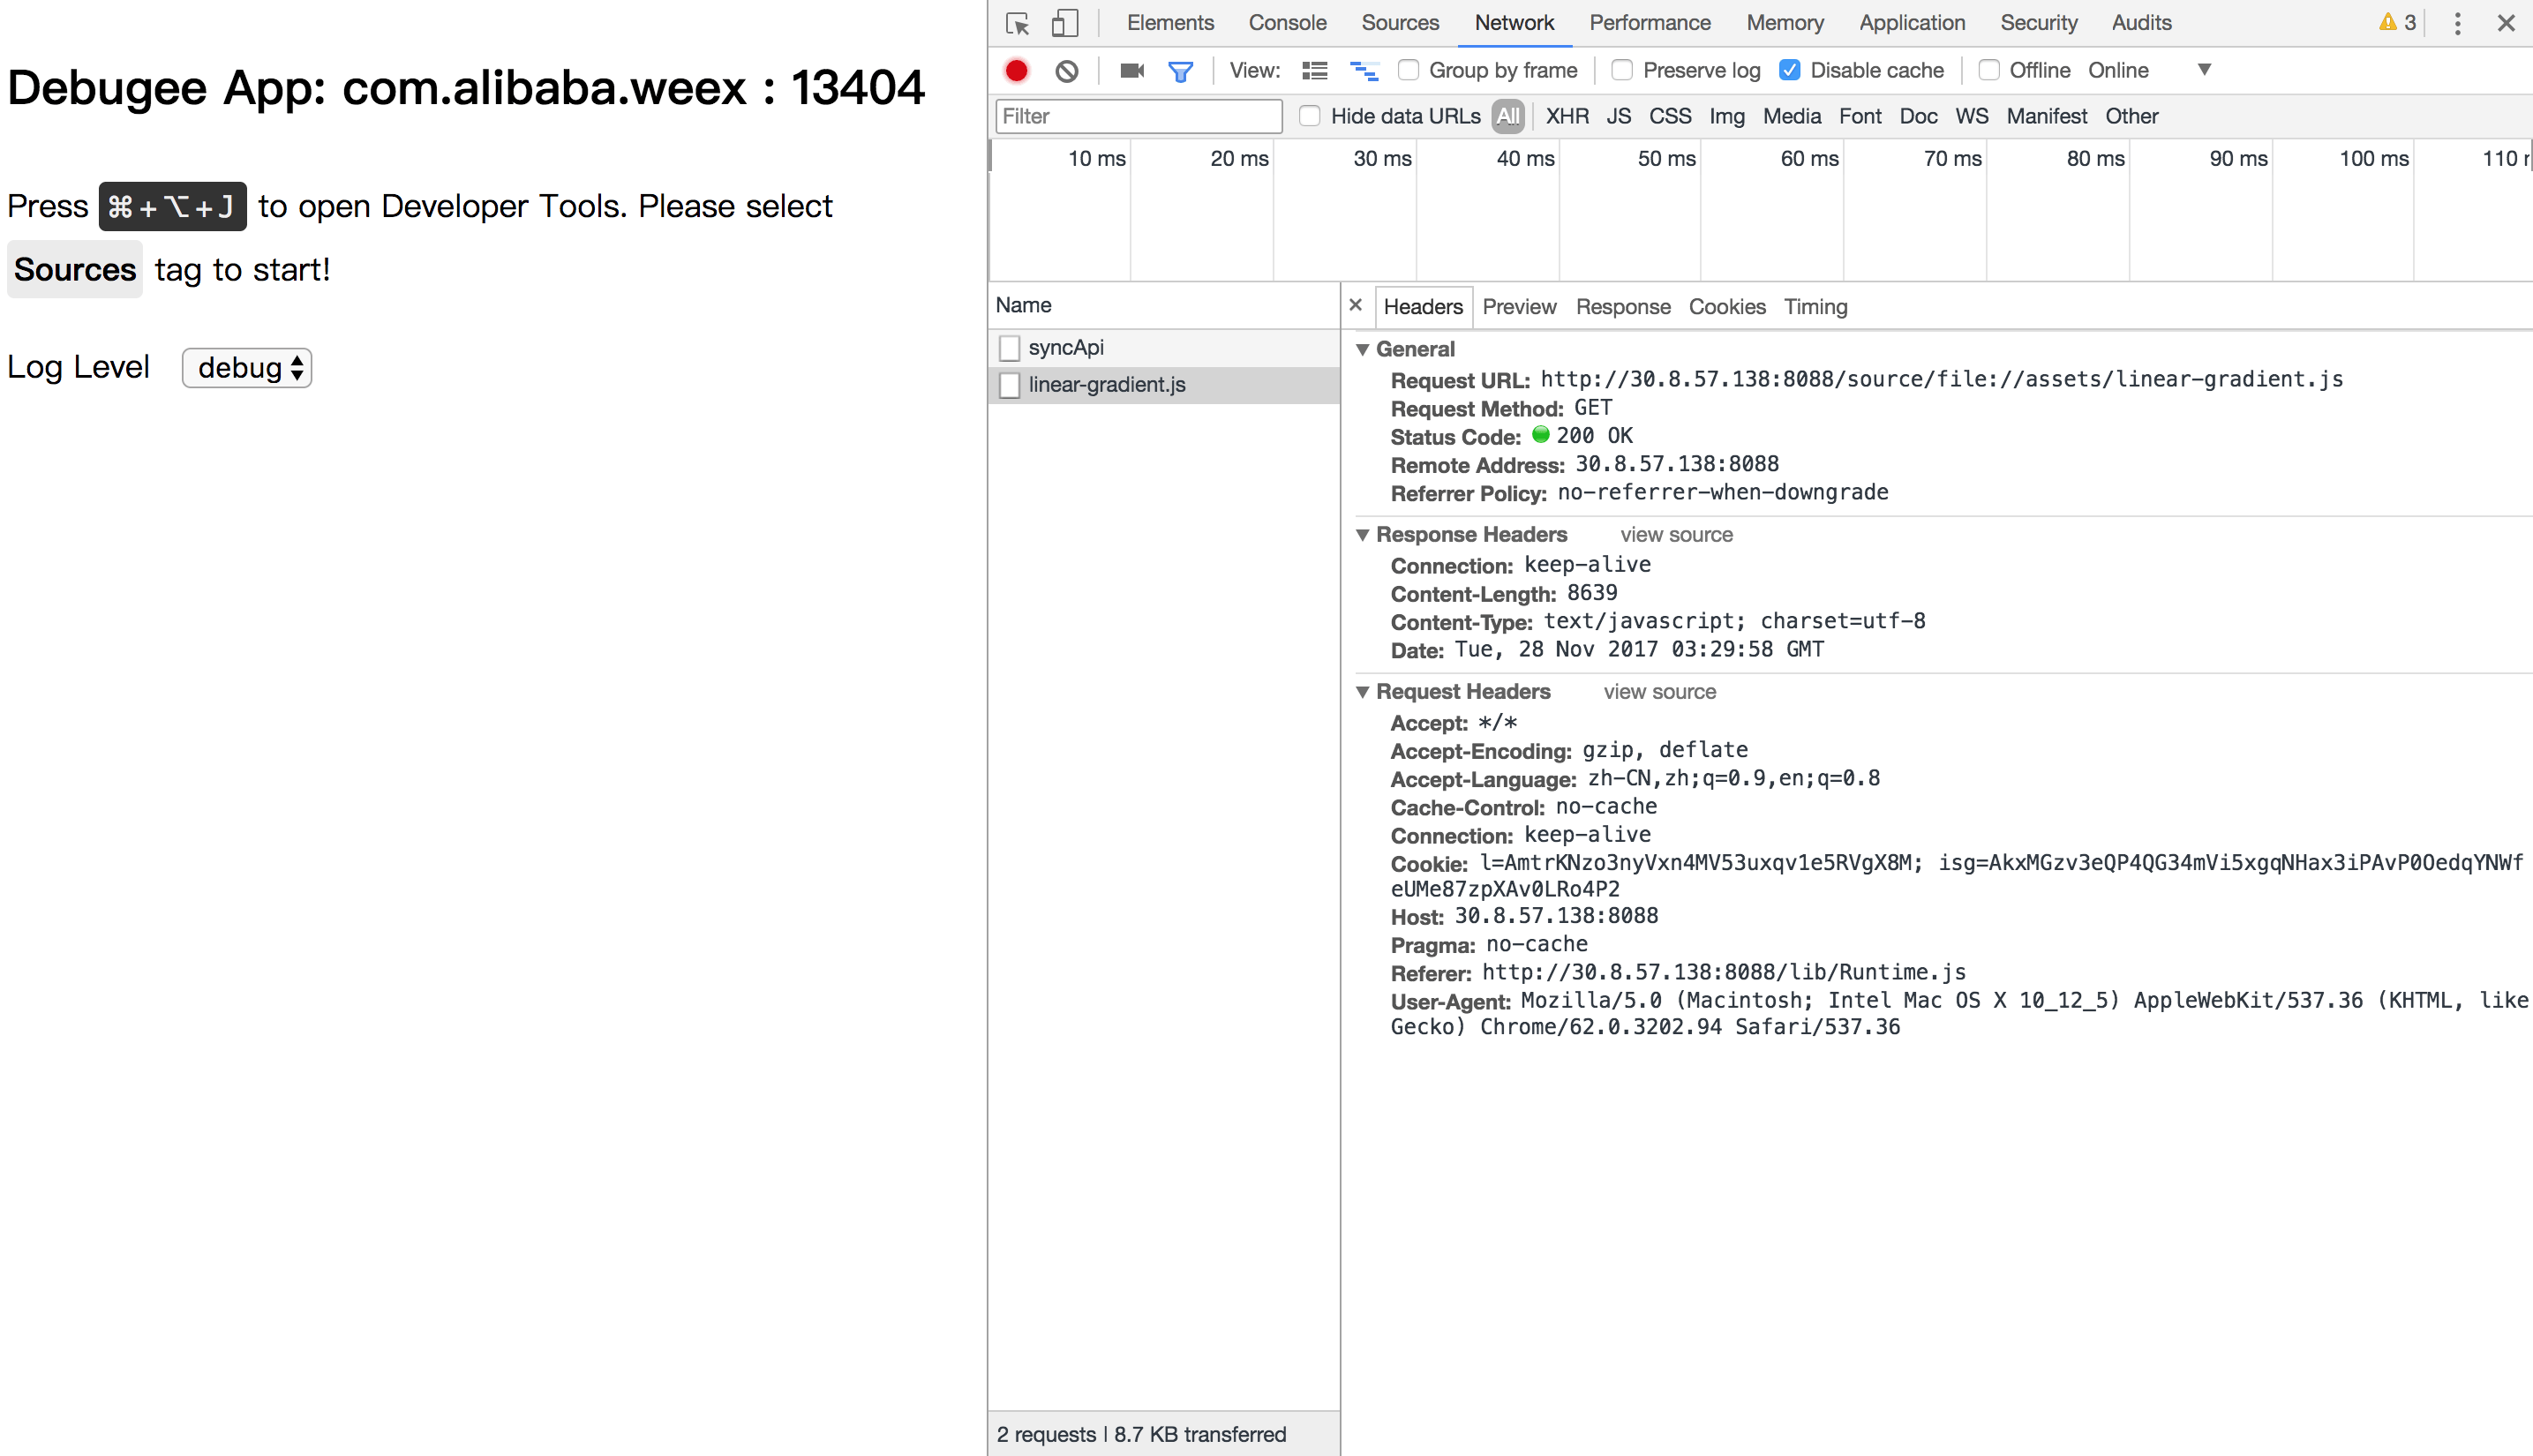
查看网络请求的header和response
控制台

资源
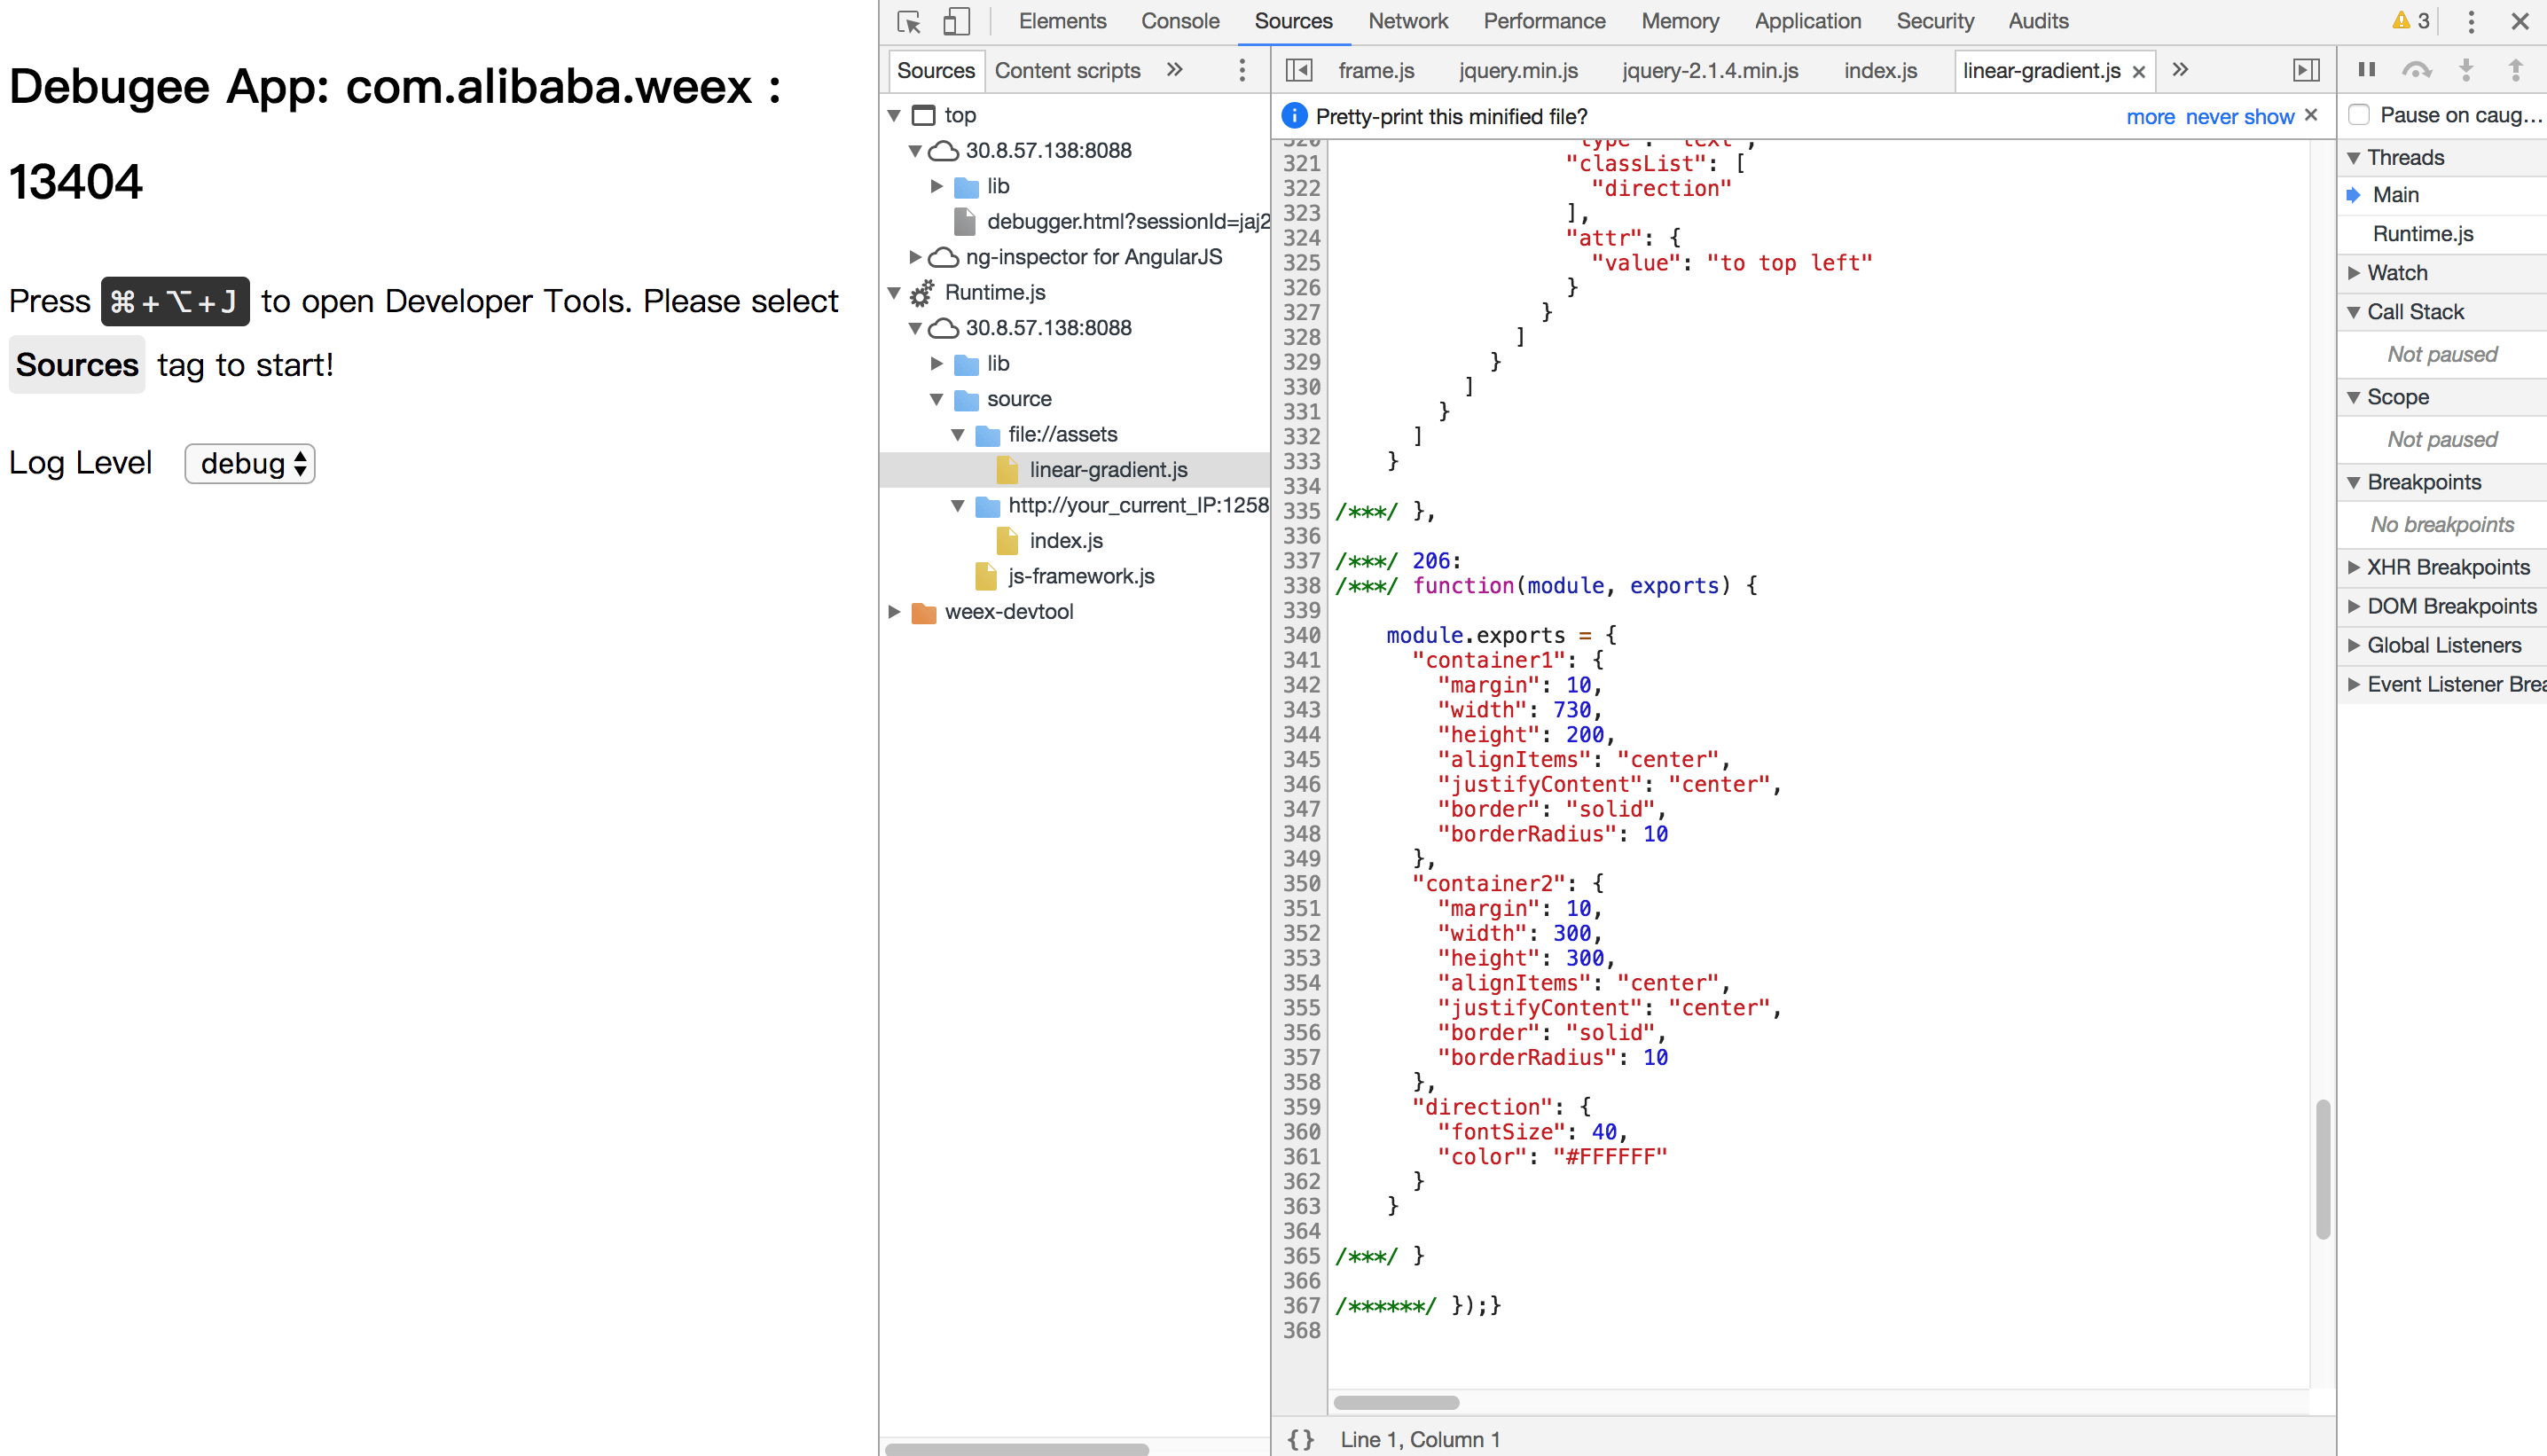
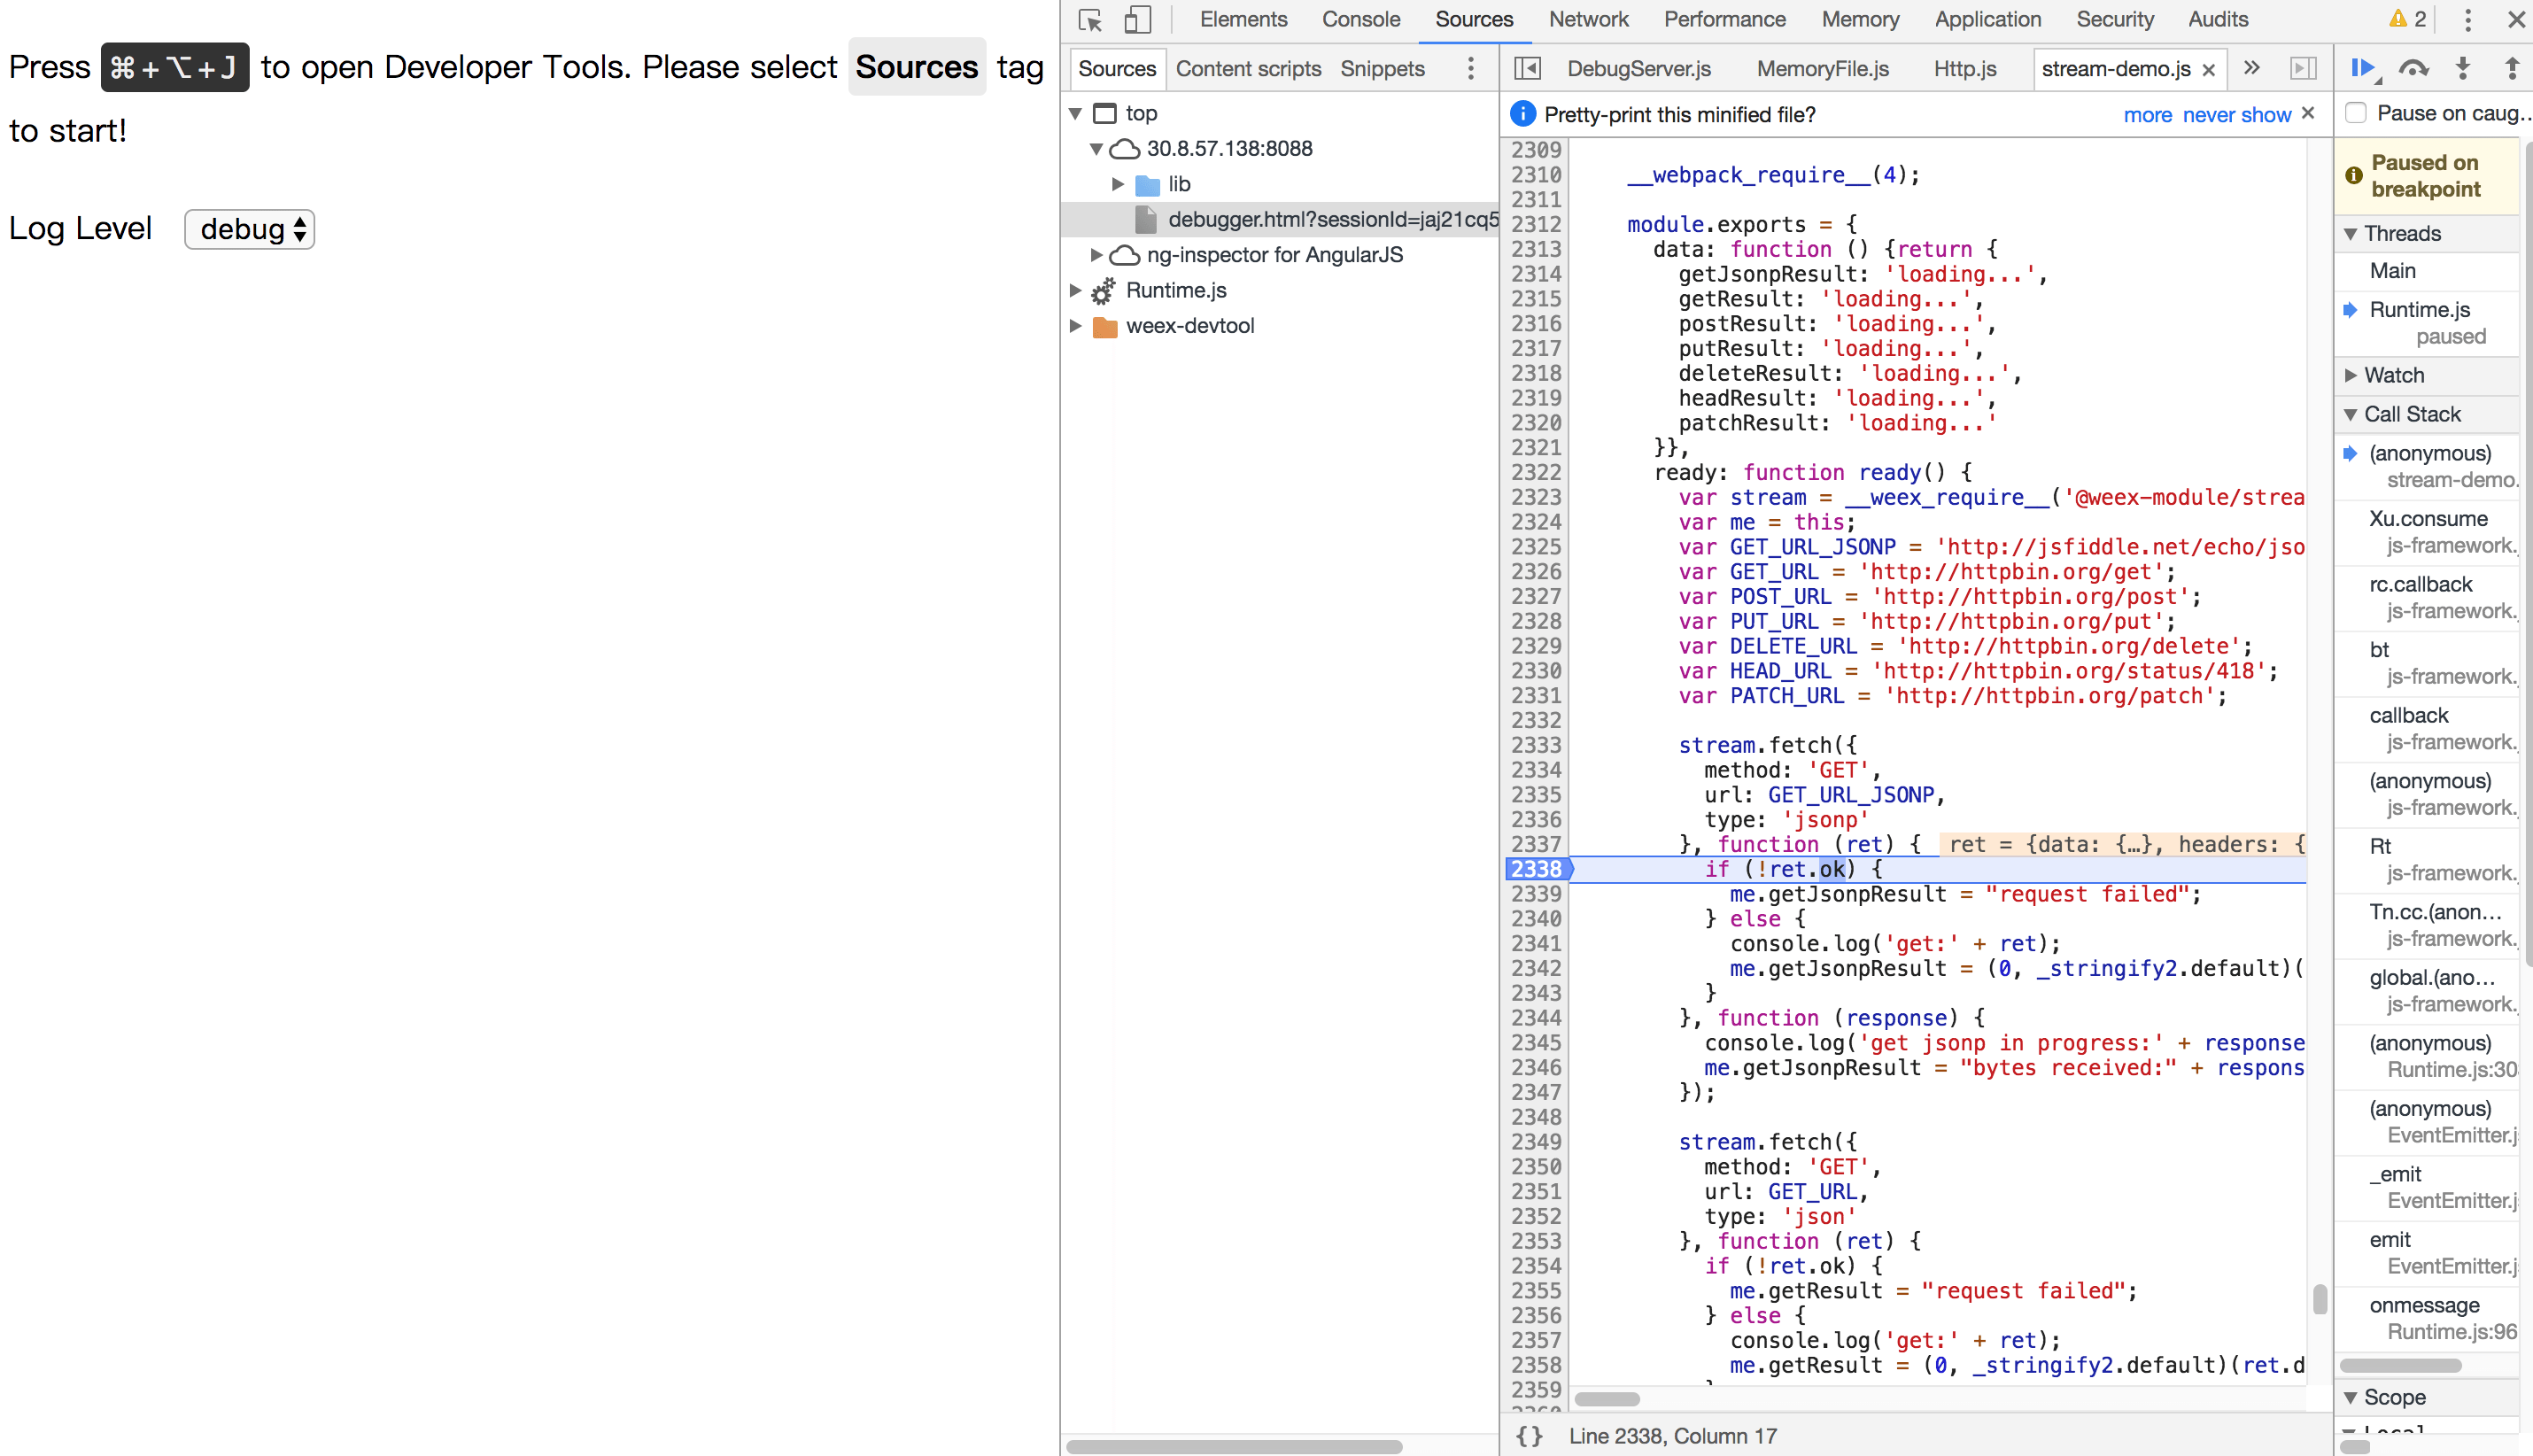
调试
调试器用来调试 Weex 中的 JS 代码,能够设置断点、查看调用栈。
Breakpoint and CallStack
集成devtool工具
- Android
- 查看文档 Weex devtools (Android), 它会引导你一步一步配置和使用它。
- iOS
- 查看文档 Weex devtools (iOS), 它会引导你一步一步配置和使用它。
