 我的书签
我的书签
 添加书签
添加书签 移除书签
移除书签- 示例 - 调试器 Example - Debuggers
- 安装一个调试器插件示例 Installing a Sample Debug Extension
- mock-debug开发环境建立 Development Setup for mock-debug
- 实现VS Code调试协议 Implementing the VS Code Debug Protocol
- 剖析调试适配器的package.json Anatomy of the Debug Adapter package.json
- 发布你的调试适配器 Publishing your Debug Adapter
- 常见问题 Common Questions
示例 - 调试器 Example - Debuggers
因为VS Code只是实现了一个通用的(未知语言)调试器界面,所以他不能和真正的调试器直接通信,而是通过一个所谓的调试适配器使用一个抽象的写入协议来通信。我们称这个协议为VS Code Debug Protocol(简写为CDP)。
一个调试适配器是一个单独的可执行程序,它和真正的调试器通信并且将抽象的CDP装换为针对调试器的具体的调试协议。
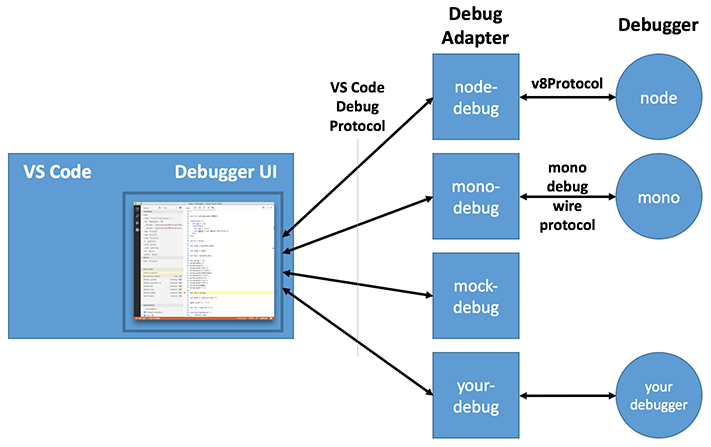
为了避免本地防火墙的问题,VS Code通过标准输入/输出来替代其他复杂的方式和适配器通信。
每个调试适配器定义了一个从VS Code启动配置中引用的调试类型。
当调试会话启动后,VS Code查找一个基于调试类型的调试适配器然后在单独的进程中启动可执行文件。当调试会话结束后,调试适配器停止运行。
调试适配器是VS Code的扩展性架构的一部分:他们被作为插件发布。之所以将调试适配器和其他插件分开是因为调试适配器的代码不运行在插件实例上,而是一个单独的程序。有两个原因:第一,使得可以使用对于调试器或者运行时来说最适合的语言来实现适配器。第二,如果有需要,一个单独的程序可以更容易地运行在高级权限下。
Visual Studio Code只内嵌了Node.js的调试器插件更多的调试器插件可以从这里找到VS Code 市场或者你可以自己创建一个调试器插件。
这篇文档将向你展示如何创建一个新的调试器插件。
In order to avoid problems with local firewalls, VS Code talks to the adapter through stdin/stdout instead of using a more sophisticated communication mechanism.
Every debug adapter defines a debug type which is referenced from a VS Code launch configuration.
When a debug session is started, VS Code looks up the debug adapter based on the debug type and launches the executable as a separate process.
When the debug session ends, the adapter is stopped.
Debug adapters are part of VS Code’s extensible architecture: they are contributed as extensions. What sets them apart from other extensions is the fact that the debug adapter code is not running in the extension host, but as a separate standalone program. The reasons for this are twofold: first, it makes it possible to implement the adapter in the language most suitable for the given debugger or runtime. Second, a standalone program can more easily run in elevated mode if the need arises.
Visual Studio Code ships with a debugger extension for Node.js. More debugger extensions are available from the VS Code Marketplace or you can create a debugger extension yourself.
This document will show you how to create a new debugger extension.
安装一个调试器插件示例 Installing a Sample Debug Extension
因为对于入门教程来说,从零开始创建一个调试适配器有些太复杂了。我们将从一个我们为了教学而创建的’starter kit’简单的调试适配器开始。它名叫’mock-debug’ 因为它并没有和真正的调试器通讯,而是虚拟了一个。所以mock-debug模拟了一个调试适配器并且支持单步,继续,断点,异常和变量查看但是它并没有连接到真正的调试器。
在探索mock-debug的开发环境设置之前,让我们先从VS Code市场上安装一个生成前版本,做如下操作:
- 使用命令面板
扩展: 安装扩展找到并安装mock-debug插件, - 重新启动VS Code。
尝试如下步骤:
- 在VS Code中,创建一个测试项目和一个新的程序文件
readme.md然后随意的输入几行文本。 - 切换到调试试图并且按下齿轮图标。
- VS Code将让你选择调试环境(选择”Mock Debugger”)然后会创建一个默认的启动配置。
如果你开始了启动配置,你可以单步调试目标文件,设置断点,运行进异常(如果单词exception出现在某一行里).
Since creating a debug adapter from scratch is a bit heavy for this tutorial, we will start with a simple debug adapter which we have created as an educational debug adapter ‘starter kit’. It is called ‘mock-debug’ because it does not talk to a real debugger but it ‘mocks’ one. So mock-debug simulates a debugger adapter and supports step, continue, breakpoints, exceptions, and variable access but it is not connected to any real debugger.
Before delving into the development setup for mock-debug, let’s first install a pre-built version
from the VS Code Marketplace and play with it:
- use the Command Palette
Extensions: Install Extensionto find and install the mock-debug extension, - restart VS Code.
To try it:
- In VS Code, create a test project with a new “program” file
readme.mdand enter several lines of arbitrary text. - Switch to the Debug view and press the gear icon.
- VS Code will let you select a debug environment (select “Mock Debugger”) and creates a default launch configuration for it.
If you now start the launch configuration, you can ‘step through’ the target file, set and hit breakpoints, and run into exceptions (if the word exception appears in a line).
mock-debug开发环境建立 Development Setup for mock-debug
现在让我们获取mock-debug的源码并开始在within VS Code开发吧:
git clone https://github.com/Microsoft/vscode-mock-debug.gitcd vscode-mock-debugnpm install
在VS Code中打开vscode-mock-debug项目目录。
包中有什么?
- mock-debug实现在
src/mockDebug.ts。这里你可以找到各种CDP请求的请求处理。 package.json,mock-debug插件的清单文件:- 列举mock-debug插件的配置项
compile和watch用来转换TypeScript源码到out目录并且监控随后的代码修改。- 两个依赖项
vscode-debugprotocol和vscode-debugadapter是基于node的调试适配器的简单开发环境NPM模块。
现在通过选择Launch Extension配置并且敲击F5来构建并启动调试适配器。
最开始将会完全的将TypeScript源码转换到out目录。
在完全构建之后,’观察任务’将被启动并增量转换接下来的改动。
在构建完成之后,一个在调试模式运行mock-debug插件的新的VS Code窗口将显示出来。
现在你可以打开你的测试项目中的readme.md文件并’调试’它。
就像像其他插件一样运行来启动调试插件相对于调试来说工作的很好。问题是调试适配器运行在插件实例外的一个单独的进程中。
解决方案是以服务模式运行调试适配器:
- 运行
mock-debug server启动配置来以服务模式启动调试适配器(它监听4711端口) - 在
mockDebug.ts文件里的launchRequest(...)方法的开始设置断点 - 在额外的VS Code窗口打开测试项目的
readme.md - 在项目里添加顶级
debugServer属性,如同下面代码:
{"version": "0.2.0","debugServer": 4711,"configurations": [{"name": "mock test","request": "launch","type": "mock","program": "${workspaceRoot}/readme.md","stopOnEntry": true}]}
- 如果你现在启动调试配置,VS Code将不会在单独的进程启动调试适配器而是连接本地端口4711。
- 此时你应该已经出发了
launchRequest中的断点。
通过上面的步骤,你可以容易的修改,编译,调试mock debug并且将它改造成你想要的调试适配器。
Now let’s get the source for mock-debug and start development on it within VS Code:
git clone https://github.com/Microsoft/vscode-mock-debug.gitcd vscode-mock-debugnpm install
Open the project folder vscode-mock-debug in VS Code.
What’s in the package?
- the mock-debug implementation lives in
src/mockDebug.ts. There you find the request handlers for the various requests of the CDP. package.json, the manifest for the mock-debug extension:- lists the contributions of the mock-debug extension.
- the
compileandwatchscripts are used to transpile the TypeScript source into theoutfolder and watch for subsequent source modifications. - the two dependencies
vscode-debugprotocolandvscode-debugadapterare NPM modules that simplify the development of node-based debug adapters.
Now build and launch the debug adapter by selecting the Launch Extension configuration and hitting F5.
Initially this will do a full transpile of the TypeScript sources into the out folder.
After the full build, a ‘watcher task’ is started that incrementally transpiles any changes you make.
After building, a new VS Code window shows up where the mock-debug extension runs in debug mode.
You can now open your test project with the readme.md file from above and ‘debug’ it.
This approach for launching the debug extension like any other extension works well for running the extension but not for debugging it. The problem is that the debug adapter runs as a separate process outside of the extension host.
The solution for this problem is to run the debug adapter in server mode:
- run the
mock-debug serverlaunch configuration to start the debug adapter in server mode (it listens on port 4711) - set a breakpoint at the beginning of method
launchRequest(...)in filemockDebug.ts - open the test project with the
readme.mdin an additional VS Code window - in that project add a top-level
debugServerattribute like this:
{"version": "0.2.0","debugServer": 4711,"configurations": [{"name": "mock test","request": "launch","type": "mock","program": "${workspaceRoot}/readme.md","stopOnEntry": true}]}
- if you now launch this debug configuration, VS Code does not launch a debug adapter as a separate process but directly connects to local port 4711.
- you should hit the breakpoint in
launchRequest.
With this setup you can now easily edit, transpile, and debug the mock debug and turn it into the debug adapter you want to create.
实现VS Code调试协议 Implementing the VS Code Debug Protocol
一个调试适配器必须实现VS Code调试协议。你可以在此处找到它的详细信息这里.
A debug adapter has to implement the VS Code Debug Protocol. You can find more details here.
剖析调试适配器的package.json Anatomy of the Debug Adapter package.json
让我们进一步看一下VS Code插件的调试适配器属性。
和每一个VS Code插件一样,调试适配器插件也拥有package.json文件来声明一些基本的属性如插件的名字, 发布者,
和 版本。使用类别 字段去让插件更容易在VS Code插件市场被找到。
{"name": "mock-debug","version": "0.10.18","publisher": "vscode","description": "Starter extension for developing debug adapters for VS Code.","engines": { "vscode": "0.10.x" },"categories": ["Debuggers"],"contributes": {"debuggers": [{"type": "mock","label": "Mock Debugger","enableBreakpointsFor": { "languageIds": ["markdown"] },"program": "./out/mockDebug.js","runtime": "node","configurationAttributes": {"launch": {"required": ["program"],"properties": {"program": {"type": "string","description": "Workspace relative path to a text file.","default": "${workspaceRoot}/readme.md"},"stopOnEntry": {"type": "boolean","description": "Automatically stop after launch.","default": true}}}},"initialConfigurations": [{"name": "Mock-Debug","type": "mock","request": "launch","program": "readme.md","stopOnEntry": true}]}]}}
更值得关注的是contributes下的debuggers节。
调试的type下介绍了一个调试适配器。
用户可以在启动配置中引用这个类型。
可选属性label可以在UI界面里给调试类型里显示一个更好看的名字。
在enableBreakpointsFor属性里你可以列出可以设置断点的语言文件类型。
因为调试适配器是一个单独的程序,program属性指定程序的路径。
为了让插件自己包含程序,必须把程序放进插件的目录。
按照惯例我们应该将程序放在名为out或者bin的目录咯,但是你也可以使用其他名字。
因为VS Code运行在不同的平台下,我们不得不确保调试适配器程序能够很好的支持不同的平台。
基于这一点有以下的选项:
如果程序实现是平台无关的,例如程序运行在可以支持全平台的运行时上,你可以通过runtime属性指定有效的运行时。目前,VS Code支持’node’和’mono’运行时。我们的mock-debug就使用了这个特性。
如果调试适配器需要在不同的平台上有不同的可执行程序,program属性可以被用来指定平台,像这样:
"debuggers": [{"type": "gdb","windows": {"program": "./bin/gdbDebug.exe",},"osx": {"program": "./bin/gdbDebug.sh",},"linux": {"program": "./bin/gdbDebug.sh",}}]
而这两种方法的组合也是可能的。接下来的例子就是需要运行在OS X和Linux运行时上的mono程序的mono-debug适配器:
"debuggers": [{"type": "mono","program": "./bin/monoDebug.exe","osx": {"runtime": "mono"},"linux": {"runtime": "mono"}}]
configurationAttributes属性指定了调试器在’launch.json’文件中建议和有效的值.
initialConfigurations在VS Code生成’launch.json’的时候被使用。这个默认启动配置将覆盖适配器启动配置。
Let’s have a closer look at the debug adapter contribution of an VS Code extension.
Like every VS Code extension, a debug adapter extension has a package.json file that declares the fundamental properties name, publisher,
and version of the extension. Use the categories field to make the extension easier to find in the VS Code Extension Marketplace.
{"name": "mock-debug","version": "0.10.18","publisher": "vscode","description": "Starter extension for developing debug adapters for VS Code.","engines": { "vscode": "0.10.x" },"categories": ["Debuggers"],"contributes": {"debuggers": [{"type": "mock","label": "Mock Debugger","enableBreakpointsFor": { "languageIds": ["markdown"] },"program": "./out/mockDebug.js","runtime": "node","configurationAttributes": {"launch": {"required": ["program"],"properties": {"program": {"type": "string","description": "Workspace relative path to a text file.","default": "${workspaceRoot}/readme.md"},"stopOnEntry": {"type": "boolean","description": "Automatically stop after launch.","default": true}}}},"initialConfigurations": [{"name": "Mock-Debug","type": "mock","request": "launch","program": "readme.md","stopOnEntry": true}]}]}}
More interesting is the specific debuggers section under contributes.
Here one debug adapter is introduced under a (unique) debug type.
The user can reference this type in his launch configurations.
The optional attribute label can be used to give the debug type a nicer name when showing it in the UI.
With the attribute enableBreakpointsFor you can list the language file types for which setting breakpoints will be enabled.
Since a debug adapter is a standalone application, a path to that application is specified under the program attribute.
In order to make the extension self-contained the application must live inside the extension folder.
By convention we keep this applications inside a folder named out or bin but you are free to use a different name.
Since VS Code runs on different platforms, we have to make sure that the debug adapter program supports the different platforms as well.
For this we have the following options:
If the program is implemented in a platform independent way, e.g. as program that runs on a runtime that is available on all supported platforms, you can specify this runtime via the runtime attribute. As of today, VS Code supports ‘node’ and ‘mono’ runtimes. Our mock-debug adapter from above uses this approach.
If your debug-adapter implementation needs different executables on different platforms, the program attribute can be qualified for specific platforms like this:
"debuggers": [{"type": "gdb","windows": {"program": "./bin/gdbDebug.exe",},"osx": {"program": "./bin/gdbDebug.sh",},"linux": {"program": "./bin/gdbDebug.sh",}}]
A combination of both approaches is possible too. The following example is from the mono-debug adapter which is implemented as a mono application that needs a runtime on OS X and Linux:
"debuggers": [{"type": "mono","program": "./bin/monoDebug.exe","osx": {"runtime": "mono"},"linux": {"runtime": "mono"}}]
configurationAttributes represent attributes that are specific for your debugger and are used for validation and suggestion of values in ‘launch.json’.
initialConfigurations is used when VS Code generates the ‘launch.json’. This should be a default launch configuration that covers configuration attributes of your adapter.
发布你的调试适配器 Publishing your Debug Adapter
当你完成了你的调试适配器时,你可以将它发布到市场上:
- 更新
package.json中的属性来体现你的调试适配器的名字和用途。 - 如这篇文章中描述的方法上传到市场共享插件。
常见问题 Common Questions
无
