 我的书签
我的书签
 添加书签
添加书签 移除书签
移除书签- 本地开发
- 启动应用
- 添加命令
- 环境配置
- 指定端口
- 单元测试
- 添加命令
- 环境配置
- 运行特定用例文件
- 指定 reporter
- 指定用例超时时间
- 通过 argv 方式传参
- 代码覆盖率
- 环境配置
- 忽略指定文件
- 调试
- 日志输出
- 使用 logger 模块
- 使用 debug 模块
- 使用 egg-bin 调试
- 添加命令
- 环境配置
- 使用 DevTools 进行调试
- 使用 WebStorm 进行调试
- 使用 VSCode 进行调试
- 更多
本地开发
为了提升研发体验,我们提供了便捷的方式在本地进行开发、调试、单元测试等。
在这里我们需要使用到 egg-bin 模块(只在本地开发和单元测试使用,如果线上请参考 应用部署)。
首先,我们需要把 egg-bin 模块作为 devDependencies 引入:
$ npm i egg-bin --save-dev
启动应用
本地启动应用进行开发活动,当我们修改代码并保存后,应用会自动重启实时生效。
添加命令
添加 npm scripts 到 package.json:
{"scripts": {"dev": "egg-bin dev"}}
这样我们就可以通过 npm run dev 命令启动应用。
环境配置
本地启动的应用是以 env: local 启动的,读取的配置也是 config.default.js 和 config.local.js 合并的结果。
指定端口
本地启动应用默认监听 7001 端口,可指定其他端口,例如:
{"scripts": {"dev": "egg-bin dev --port 7001"}}
单元测试
这里主要讲解工具部分的使用,更多关于单元测试的内容请参考这里。
添加命令
添加 npm scripts 到 package.json:
{"scripts": {"test": "egg-bin test"}}
这样我们就可以通过 npm test 命令运行单元测试。
环境配置
测试用例执行时,应用是以 env: unittest 启动的,读取的配置也是 config.default.js 和 config.unittest.js 合并的结果。
运行特定用例文件
运行 npm test 时会自动执行 test 目录下的以 .test.js 结尾的文件(默认 glob 匹配规则 test/**/*.test.js )。
我们在编写用例时往往想单独执行正在编写的用例,可以通过以下方式指定特定用例文件:
$ TESTS=test/x.test.js npm test
支持 glob 规则。
指定 reporter
Mocha 支持多种形式的 reporter,默认使用 spec reporter。
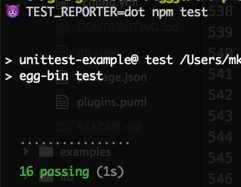
可以手动设置 TEST_REPORTER 环境变量来指定 reporter,例如使用 dot:
$ TEST_REPORTER=dot npm test
指定用例超时时间
默认执行超时时间为 30 秒。我们也可以手动指定超时时间(单位毫秒),例如设置为 5 秒:
$ TEST_TIMEOUT=5000 npm test
通过 argv 方式传参
egg-bin test 除了环境变量方式,也支持直接传参,支持 mocha 的所有参数,参见:mocha usage 。
$ # npm 传递参数需额外加一个 `--`,参见 https://docs.npmjs.com/cli/run-script$ npm test -- --help$$ # 等同于 `TESTS=test/**/test.js npm test`,受限于 bash,最好加上双引号$ npm test "test/**/test.js"$$ # 等同于 `TEST_REPORTER=dot npm test`$ npm test -- --reporter=dot$$ # 支持 mocha 的参数,如 grep / require 等$ npm test -- -t 30000 --grep="should GET"
代码覆盖率
egg-bin 已经内置了 nyc 来支持单元测试自动生成代码覆盖率报告。
添加 npm scripts 到 package.json:
{"scripts": {"cov": "egg-bin cov"}}
这样我们就可以通过 npm run cov 命令运行单元测试覆盖率。
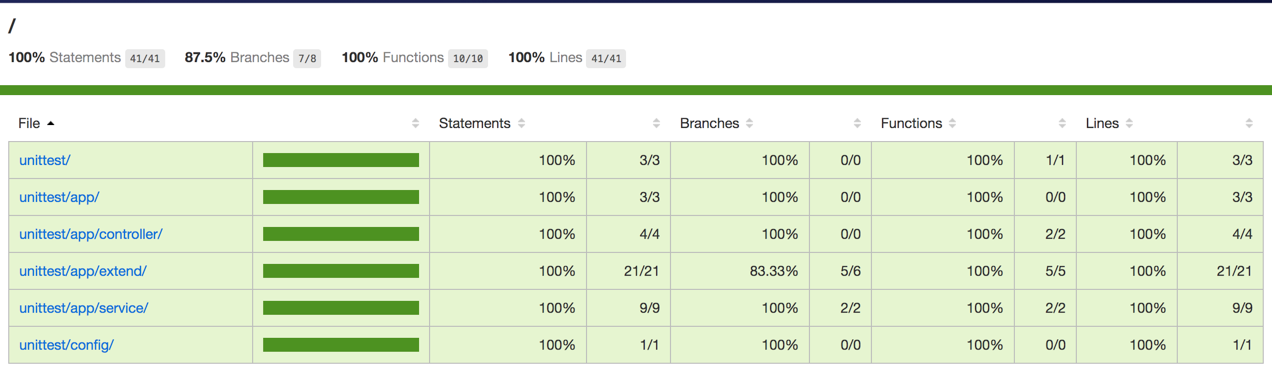
$ egg-bin covtest/controller/home.test.jsGET /✓ should status 200 and get the bodyPOST /post✓ should status 200 and get the request body...16 passing (1s)=============================== Coverage summary ===============================Statements : 100% ( 41/41 )Branches : 87.5% ( 7/8 )Functions : 100% ( 10/10 )Lines : 100% ( 41/41 )================================================================================
还可以通过 open coverage/lcov-report/index.html 打开完整的 HTML 覆盖率报告。
环境配置
和 test 命令一样,cov 命令执行时,应用也是以 env: unittest 启动的,读取的配置也是 config.default.js 和 config.unittest.js 合并的结果。
忽略指定文件
对于某些不需要跑测试覆盖率的文件,可以通过 COV_EXCLUDES 环境变量指定:
$ COV_EXCLUDES=app/plugins/c* npm run cov$ # 或者传参方式$ npm run cov -- --x=app/plugins/c*
调试
日志输出
使用 logger 模块
框架内置了日志 功能,使用 logger.debug() 输出调试信息,推荐在应用代码中使用它。
// controllerthis.logger.debug('current user: %j', this.user);// servicethis.ctx.logger.debug('debug info from service');// app/init.jsapp.logger.debug('app init');
通过 config.logger.level 来配置打印到文件的日志级别,通过 config.logger.consoleLevel 配置打印到终端的日志级别。
使用 debug 模块
debug 模块是 Node.js 社区广泛使用的 debug 工具,很多模块都使用它模块打印调试信息,Egg 社区也广泛采用这一机制打印 debug 信息,推荐在框架和插件开发中使用它。
我们可以通过 DEBUG 环境变量选择开启指定的调试代码,方便观测执行过程。
(调试模块和日志模块不要混淆,而且日志模块也有很多功能,这里所说的日志都是调试信息。)
开启所有模块的日志:
$ DEBUG=* npm run dev
开启指定模块的日志:
$ DEBUG=egg* npm run dev
单元测试也可以用 DEBUG=* npm test 来查看测试用例运行的详细日志。
使用 egg-bin 调试
添加命令
添加 npm scripts 到 package.json:
{"scripts": {"debug": "egg-bin debug"}}
这样我们就可以通过 npm run debug 命令来断点调试应用。
egg-bin 会智能选择调试协议,在 8.x 之后版本使用 Inspector Protocol 协议,低版本使用 Legacy Protocol。
同时也支持自定义调试参数:
$ egg-bin debug --inpsect=9229
master调试端口为 9229 或 5858(旧协议)agent调试端口固定为 5800,可以传递process.env.EGG_AGENT_DEBUG_PORT来自定义。worker调试端口为master调试端口递增。- 开发阶段 worker 在代码修改后会热重启,导致调试端口会自增,参见下文的 IDE 配置以便自动重连。
环境配置
执行 debug 命令时,应用也是以 env: local 启动的,读取的配置是 config.default.js 和 config.local.js 合并的结果。
使用 DevTools 进行调试
最新的 DevTools 只支持 Inspector Protocol 协议,故你需要使用 Node.js 8.x+ 的版本方能使用。
执行 npm run debug 启动:
➜ showcase git:(master) ✗ npm run debug> showcase@1.0.0 debug /Users/tz/Workspaces/eggjs/test/showcase> egg-bin debugDebugger listening on ws://127.0.0.1:9229/f8258ca6-d5ac-467d-bbb1-03f59bcce85bFor help see https://nodejs.org/en/docs/inspector2017-09-14 16:01:35,990 INFO 39940 [master] egg version 1.8.0Debugger listening on ws://127.0.0.1:5800/bfe1bf6a-2be5-4568-ac7d-69935e0867faFor help see https://nodejs.org/en/docs/inspector2017-09-14 16:01:36,432 INFO 39940 [master] agent_worker#1:39941 started (434ms)Debugger listening on ws://127.0.0.1:9230/2fcf4208-4571-4968-9da0-0863ab9f98aeFor help see https://nodejs.org/en/docs/inspector9230 openedDebug Proxy online, now you could attach to 9999 without worry about reload.DevTools → chrome-devtools://devtools/bundled/inspector.html?experiments=true&v8only=true&ws=127.0.0.1:9999/__ws_proxy__
然后选择以下一种方式即可:
- 直接访问控制台最后输出的
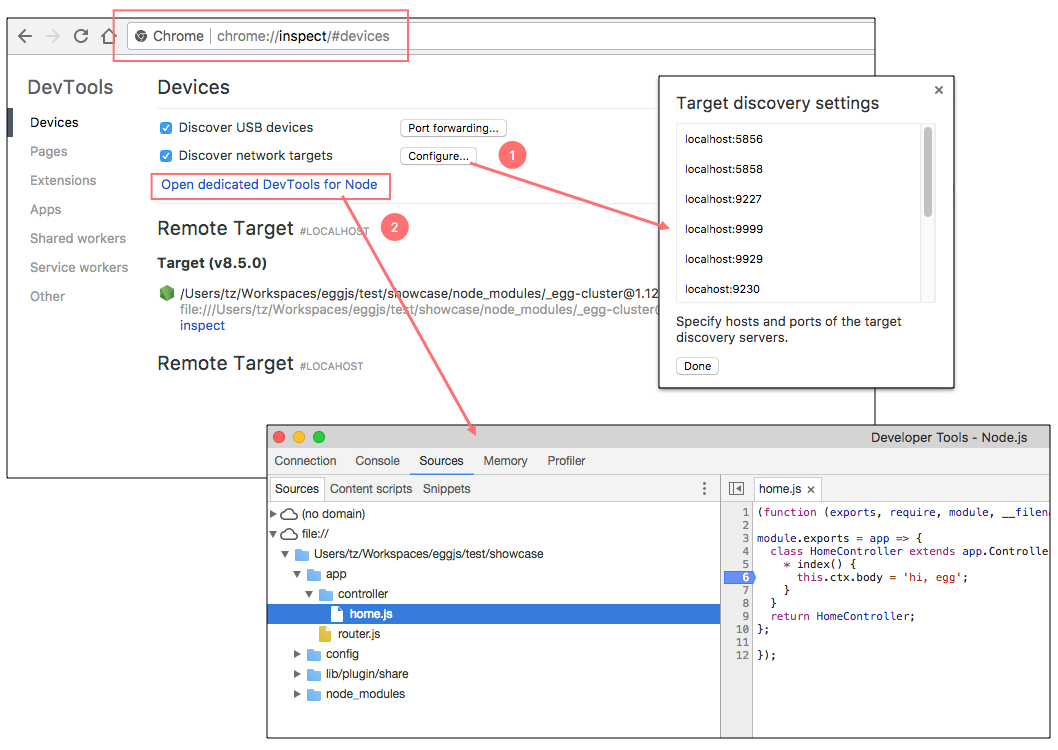
DevTools地址,该地址是代理后的 worker,无需担心重启问题。 - 访问
chrome://inspect,配置对应的端口,然后点击Open dedicated DevTools for Node即可打开调试控制台。
使用 WebStorm 进行调试
egg-bin 会自动读取 WebStorm 调试模式下设置的环境变量 $NODE_DEBUG_OPTION。
使用 WebStorm 的 npm 调试启动即可:

使用 VSCode 进行调试
可以通过 2 个方式:
方式一:开启 VSCode 配置 Debug: Toggle Auto Attach,然后在 Terminal 执行 npm run debug 即可。
方式二:配置 VSCode 的 .vscode/launch.json,然后 F5 一键启动即可。(注意,需要关闭方式一中的配置)
// .vscode/launch.json{"version": "0.2.0","configurations": [{"name": "Launch Egg","type": "node","request": "launch","cwd": "${workspaceRoot}","runtimeExecutable": "npm","windows": { "runtimeExecutable": "npm.cmd" },"runtimeArgs": [ "run", "debug" ],"console": "integratedTerminal","protocol": "auto","restart": true,"port": 9229,"autoAttachChildProcesses": true}]}
我们也提供了一个 vscode-eggjs 扩展来自动生成配置。

更多 VSCode Debug 用法可以参见文档: Node.js Debugging in VS Code
更多
如果想了解更多本地开发相关的内容,例如为你的团队定制一个本地开发工具,请参考 egg-bin。
